Quick Navigation
Config File Training
Installation
Edit Configuration File
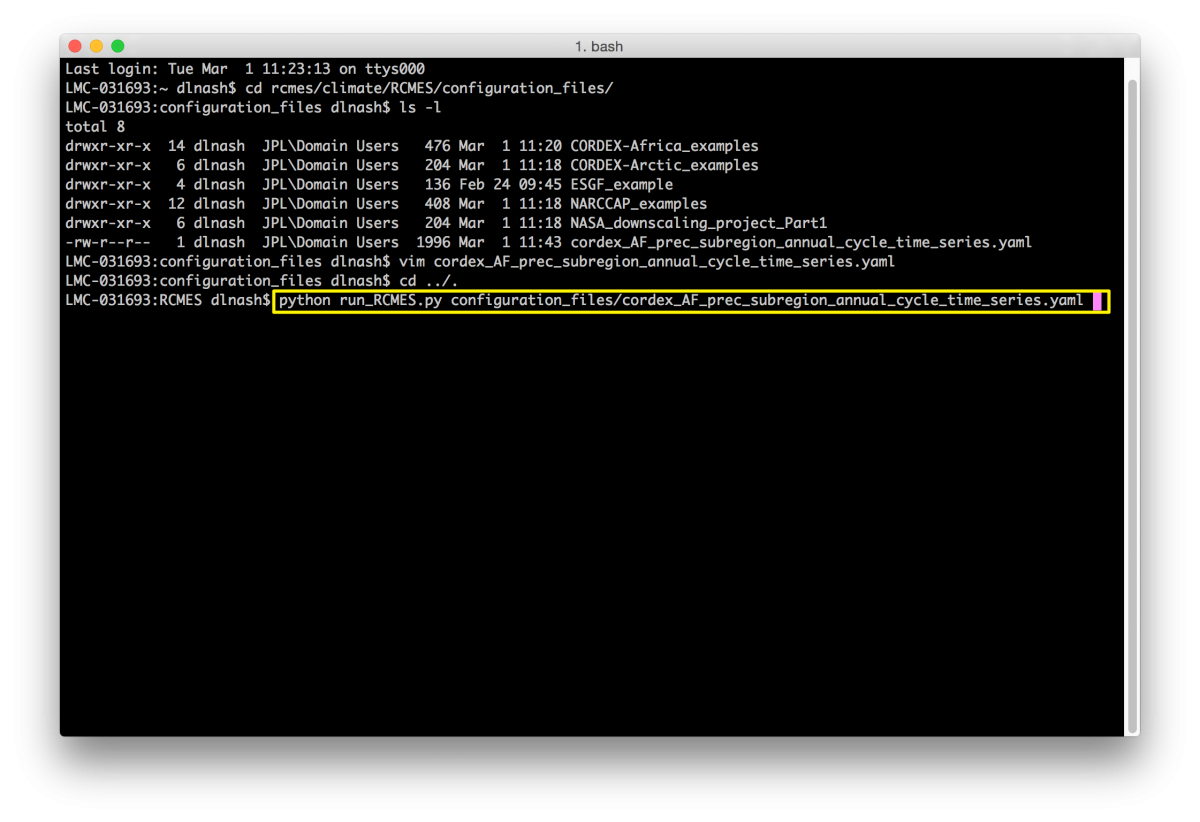
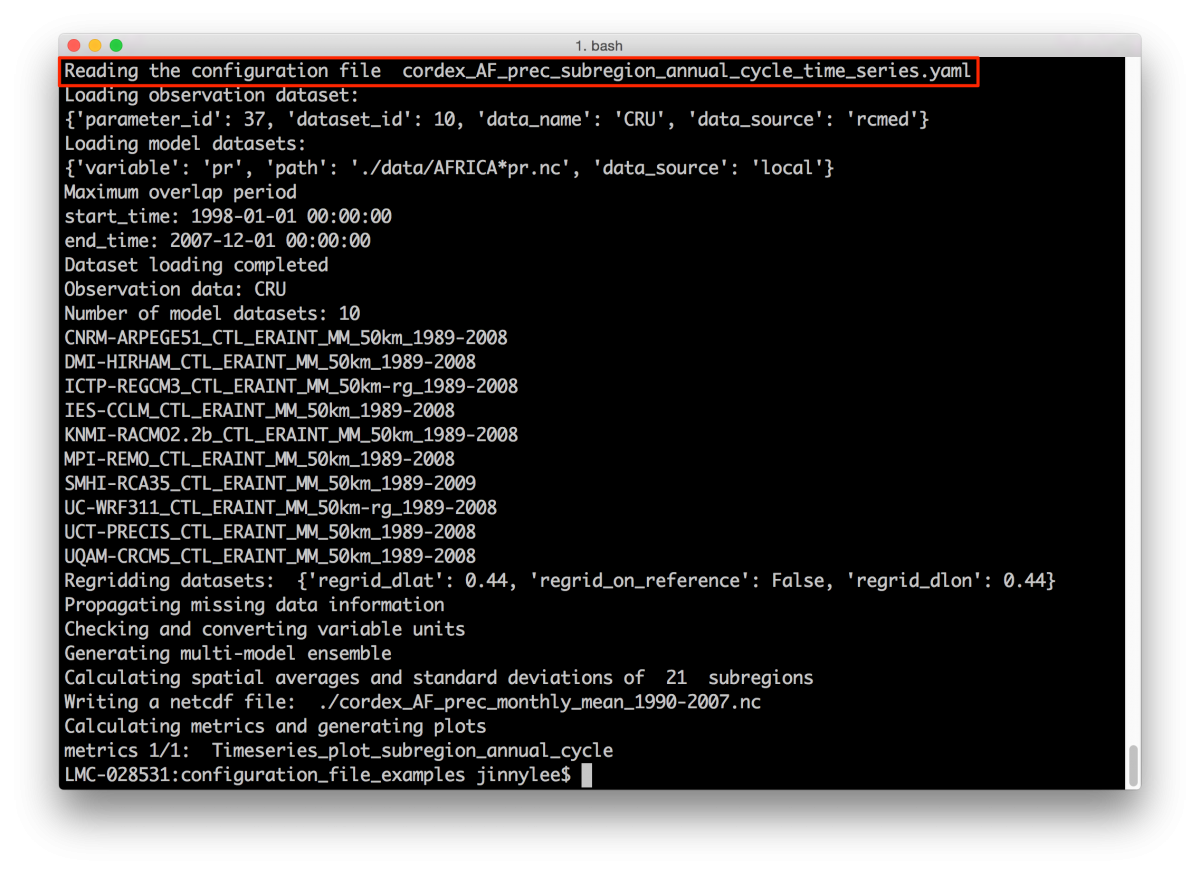
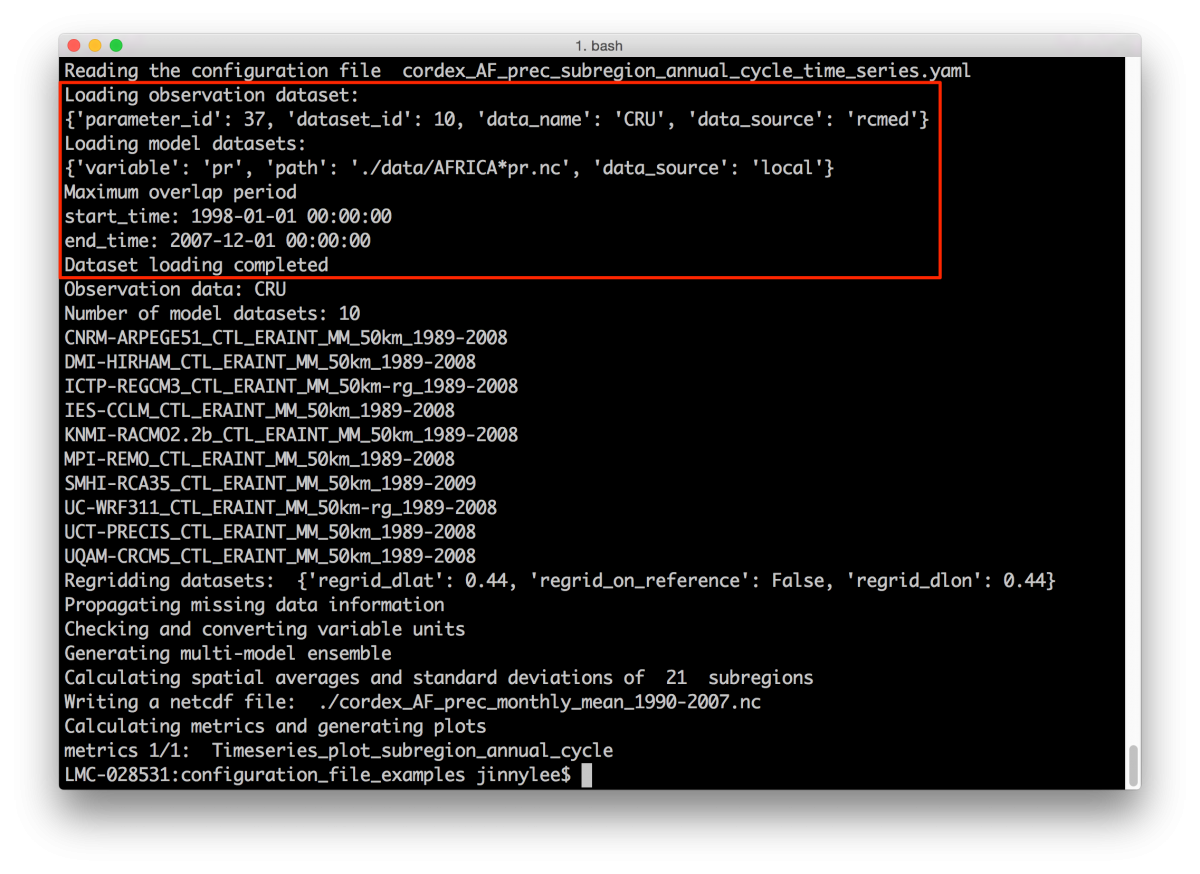
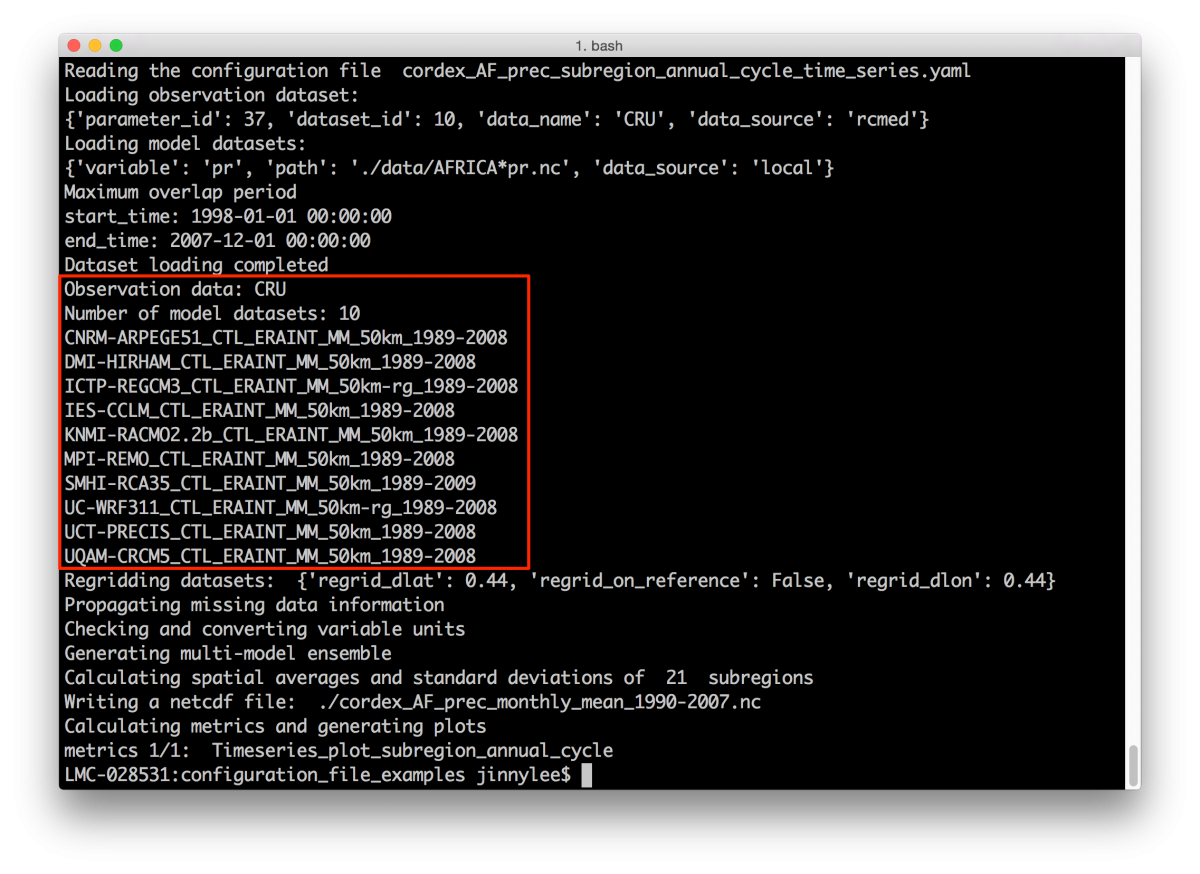
Run the Model Evaluation
Helpful Tips
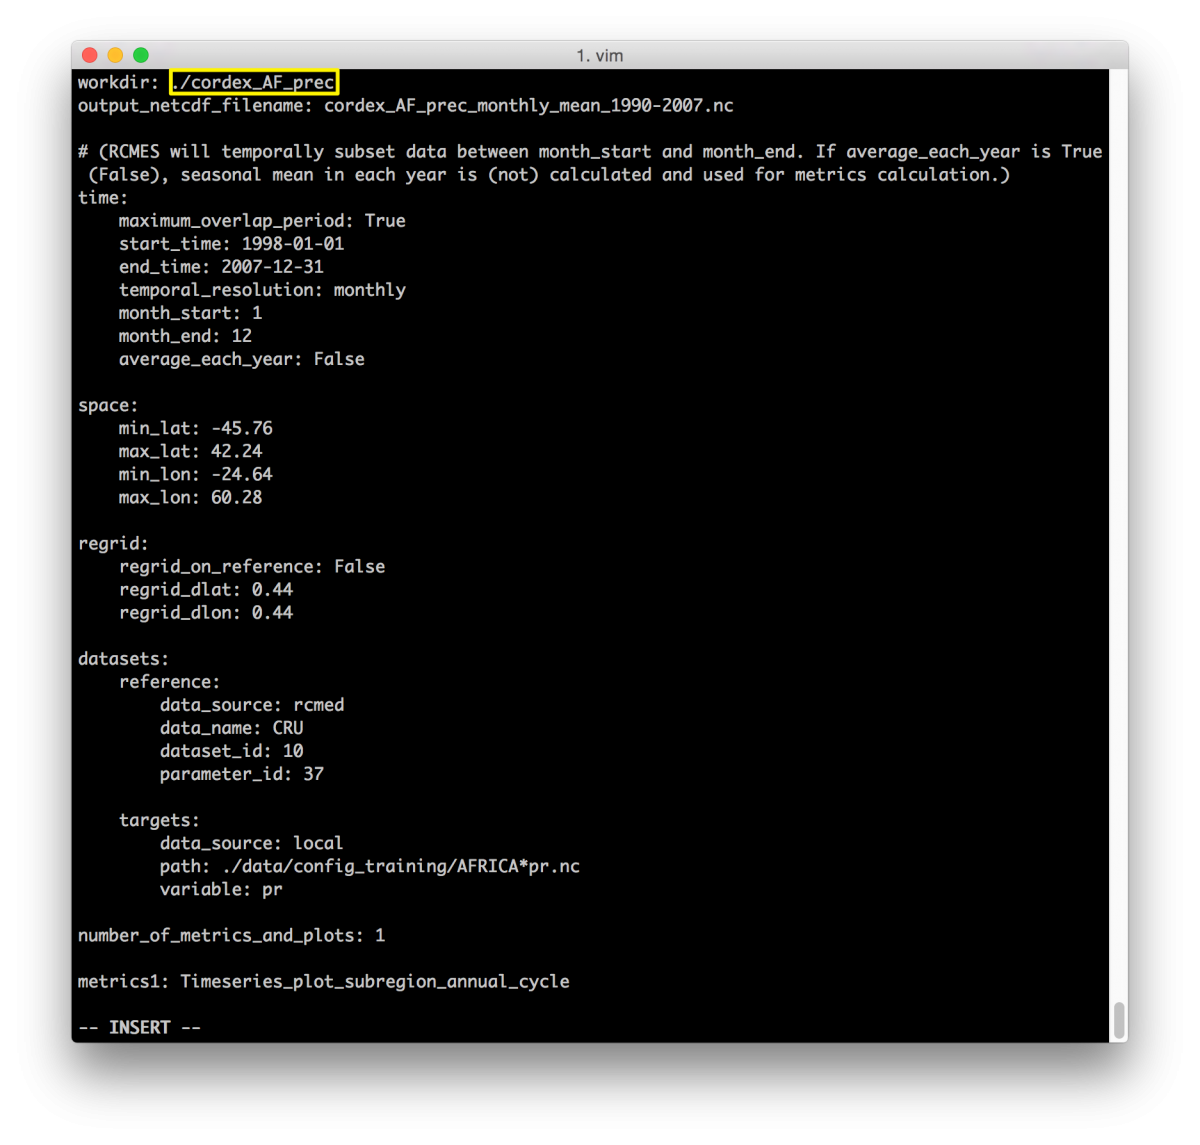
The following is a config file with its parameters noted by red boxes.
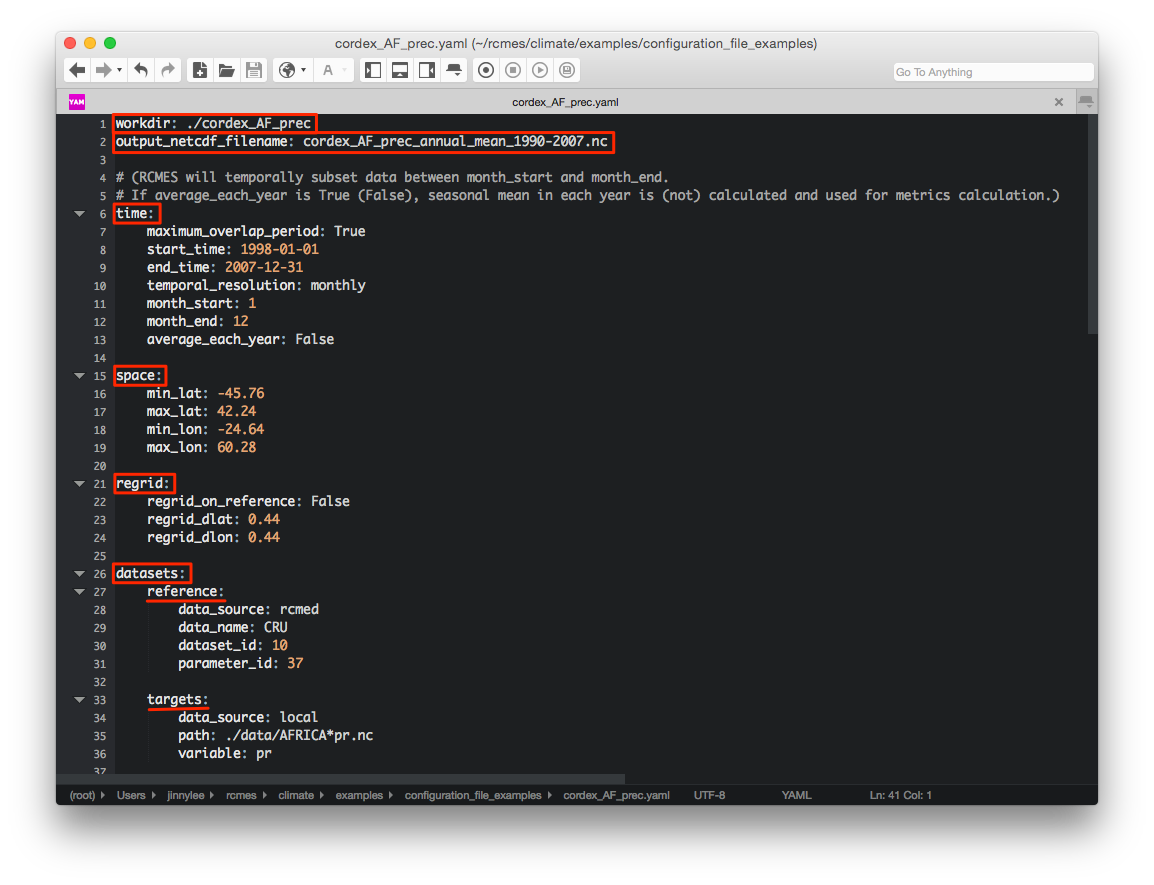
Indepth Look at a Config File
- workdir - indicates the path of the folder you would like to create and have all of the plots and netCDF of the analysis placed into it
./denotes the path of the current folder this config file is located in
- output_netcdf_filename - the name of the netCDF file to be created
 |
- time - defines temporal boundaries
- maximum_overlap_period
- True - RCMES will analyze time periods in which the model and observation overlaps
- False -
- start_time & end_time format
- YYYY-MM-DD
- temporal_resolution
- monthly
- daily
- average_each_year
- True - seasonal mean in each year is calculated
- False - seasonal means in each year is not calculated
- maximum_overlap_period
 |
- space - defines spatial boundaries
 |
- regrid - defines spatial regridding
- regrid_on_reference
- True - regrid on reference grid (observation)
- False - does not regrid on reference grid
- regrid_on_reference
 |
- Observation and Model Datasets
- Load Data Files (THREE OPTIONS)
Option 1: use RCMED
- loader_name: rcmed
name: CRU
dataset_id: 10
parameter_id: 37
 |
Option 2: use local file; the asterisk (*) is a wildcard and RCMES will search for all files with a path identical to the input, ignoring the differences where the asterisk placeholder is
- loader_name: local
path: ./data/config_training/AFRICA*pr.nc
variable: pr
 |
Option 3: use ESGF
- loader_name: esgf
- name: AVISO
- dataset_id: obs4MIPs.CNES.AVISO.zos.mon.v20110829|esgf-data.jpl.nasa.gov
- variable: zos
 |
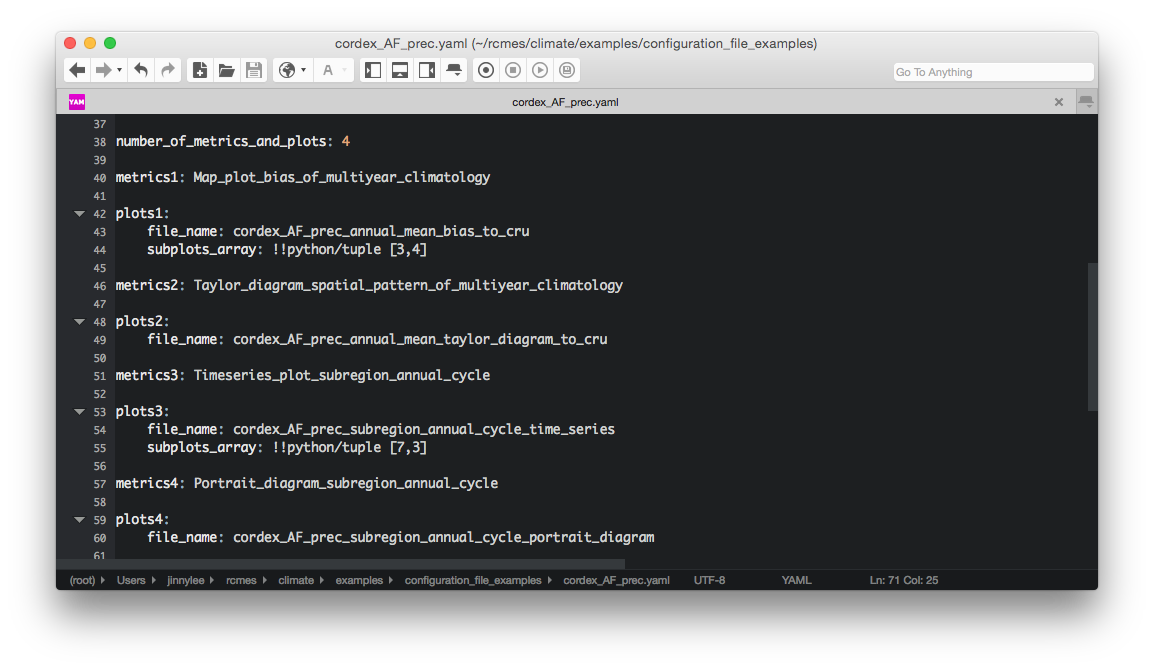
This section of the config file indicates which metrics and plots are produced. Here, you can select up to 4 metrics and plots. For example, if 3 is chosen, then metrics 1-3 and plots 1-3 are produced.
 |
plots1 - produces a bias plot of the observation against individual models
 |
 |
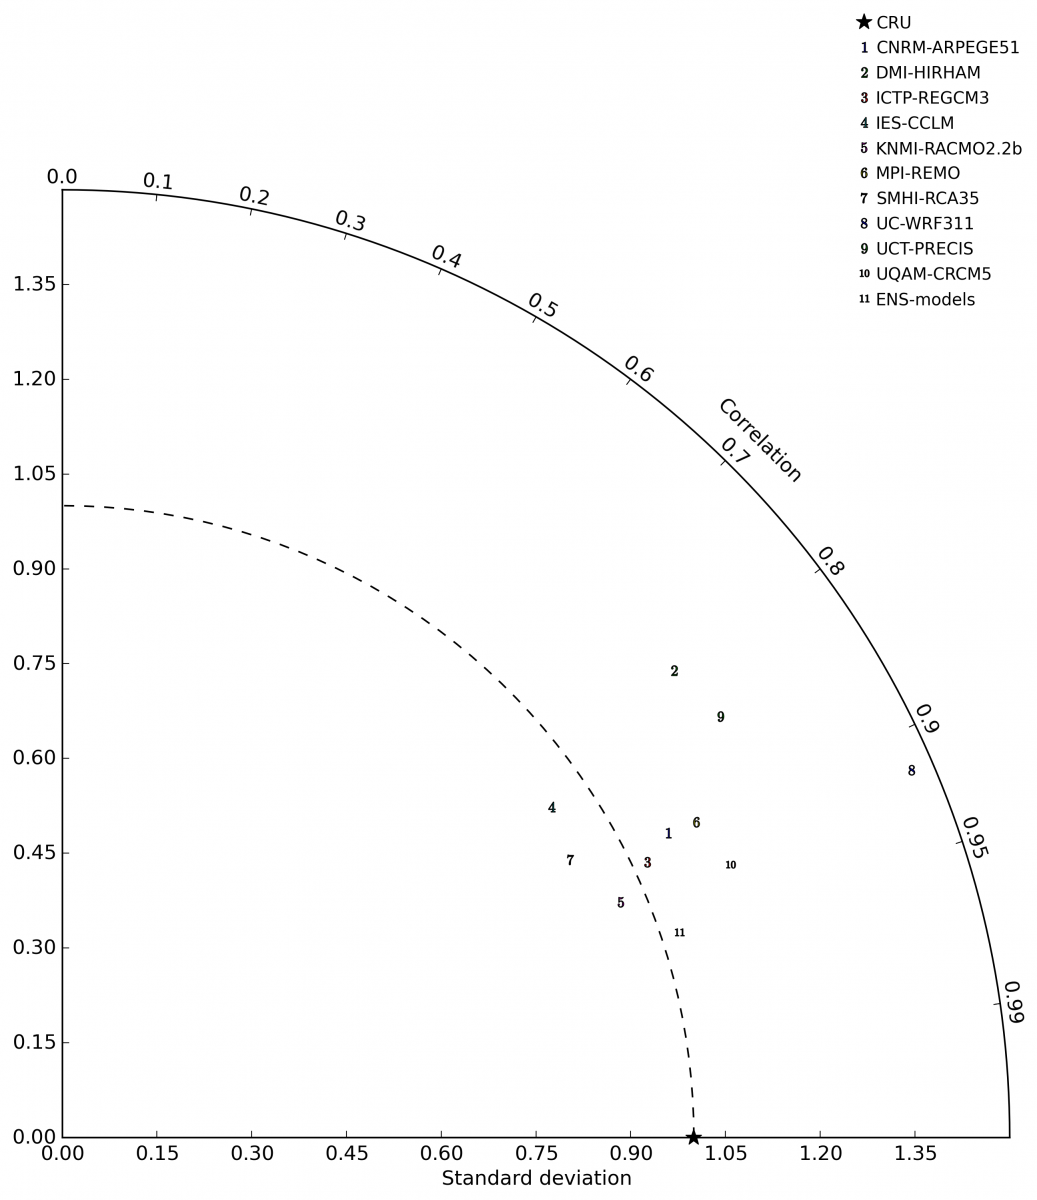
plots2 - produces a taylor diagram of spatial pattern correlations and standardized deviations with respect to the observation
 |
 |
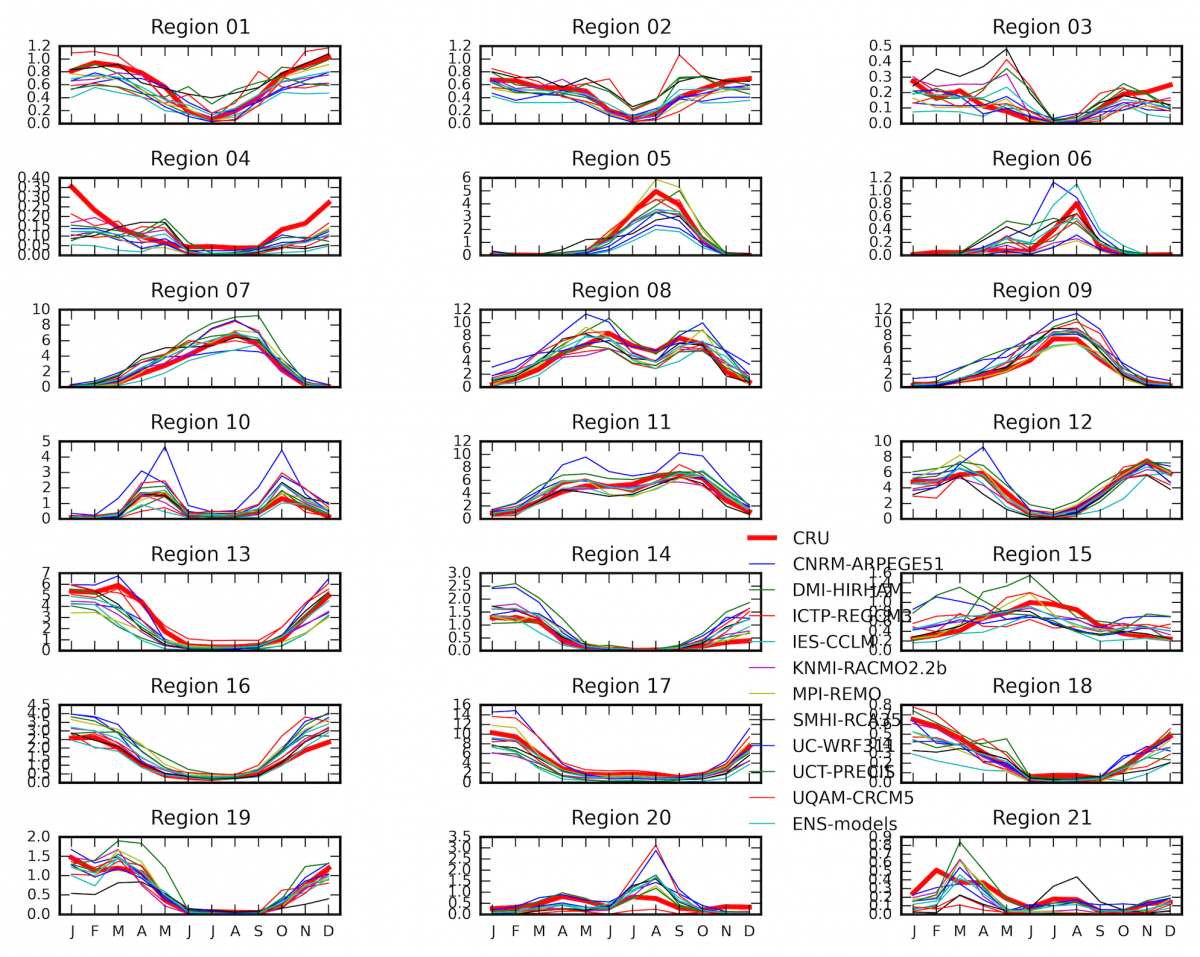
plots3 - produces a time series annual plot of all defined subregions
 |
 |
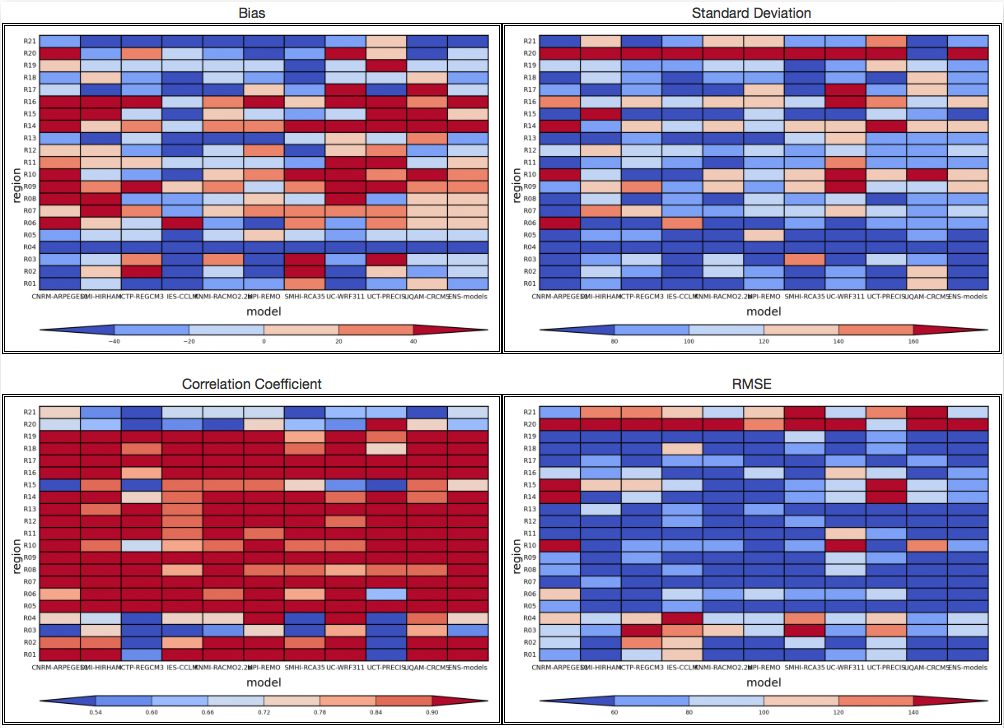
plots4 - produces 4 portrait diagrams for all defined subregions
 |
 |
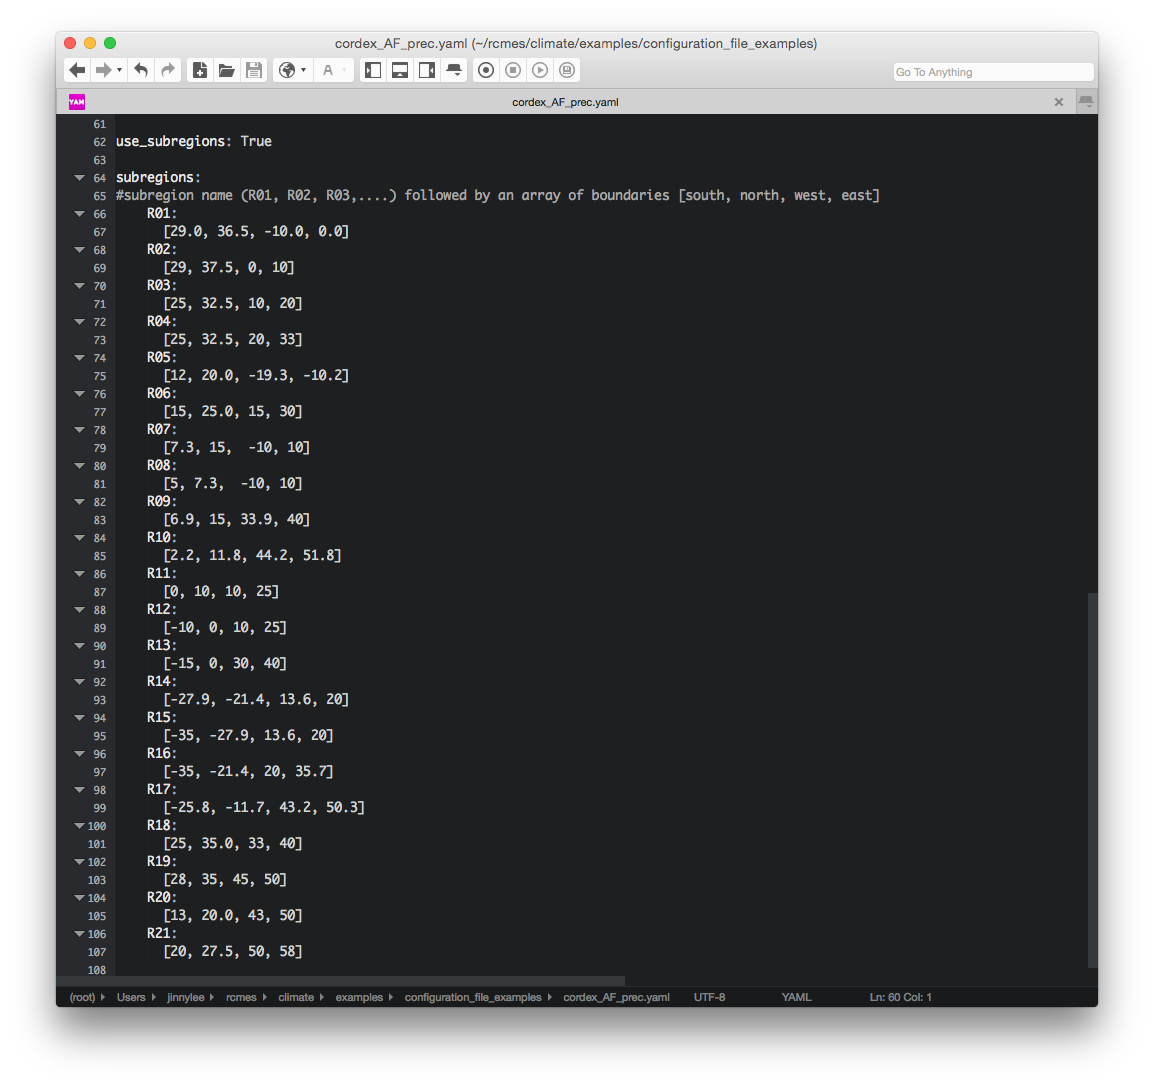
This section of the config file defines each of the subregions by indicating the boundaries in an array using latitude and longitude.
- south = minimum latitude
- north = maximum latitude
- west = minimum longitude
- east = maximum longitude
Config File Training
This training will provide a step-by-step guide for perfoming a simple model evaluation with RCMES using configuration files. We will reproduce some of the figures from Kim et al. (2013a) publication as an example. To replicate this paper in its entirety, please refer to the CF site for that paper.
Download
Download and Install RCMES
If you have not already done so, please go to the RCMES Download Page and install RCMES using either VM or Easy OCW.
Download Model and Observation Datasets for Tutorial
This tutorial uses model data that will need to be downloaded and saved to a specific directory within RCMES.
CLICK HERE to download the data for this tutorial.
If you are using VM for this tutorial, you will need to follow the instructions from Part VII. Using the VM for RCMES Tutorials found on the VM Install Page. These instructions will show you where to save the data and how to mount it within RCMES. Once you have your downloaded data mounted within RCMES in the VM, continue on to the Edit the Configuration File section of this tutorial.
If you are using Easy OCW for this tutorial, you will need to save the config_file_data folder to your data folder in RCMES. (~/climate/RCMES/data)
Note: You may need to create the data folder. To do so, using Terminal, move to the main RCMES folder, and type: "mkdir data".
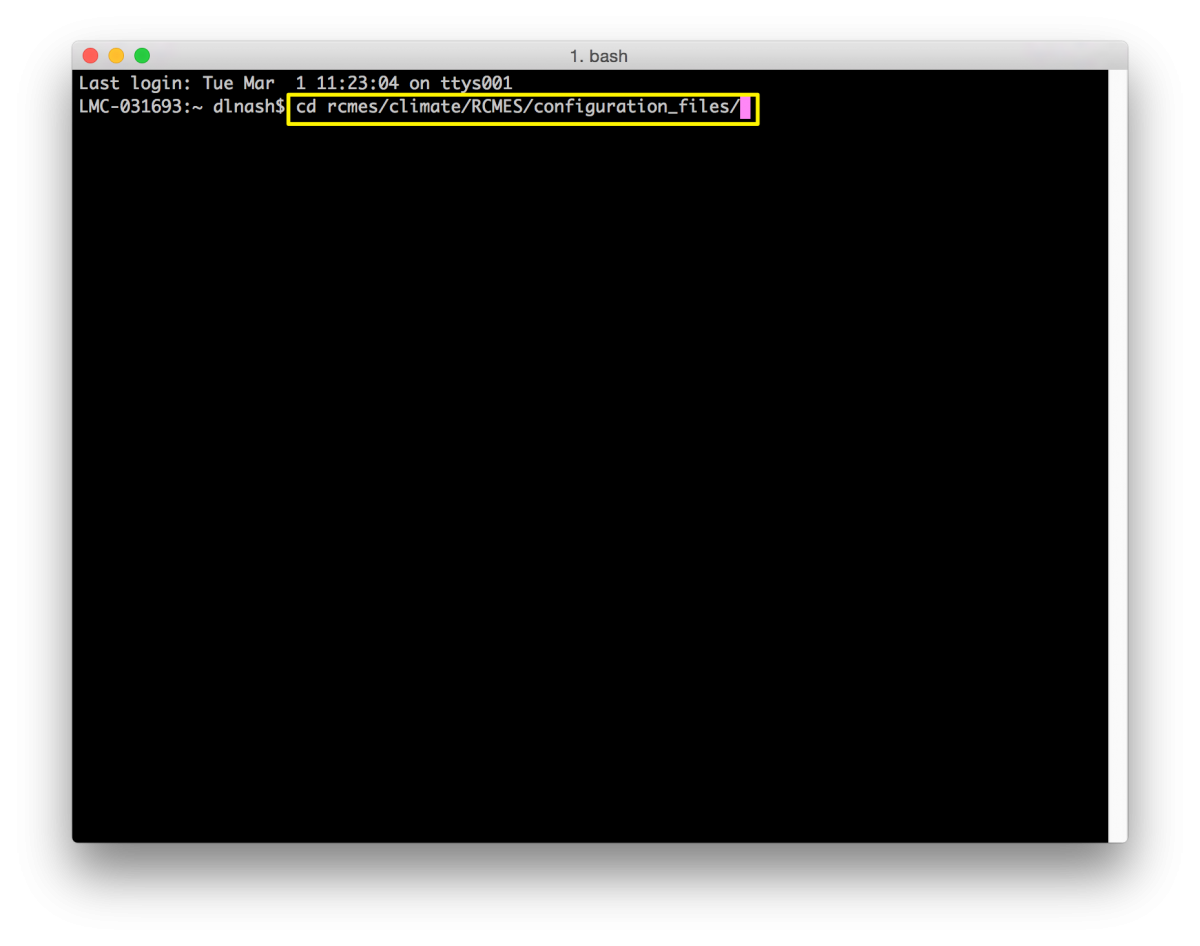
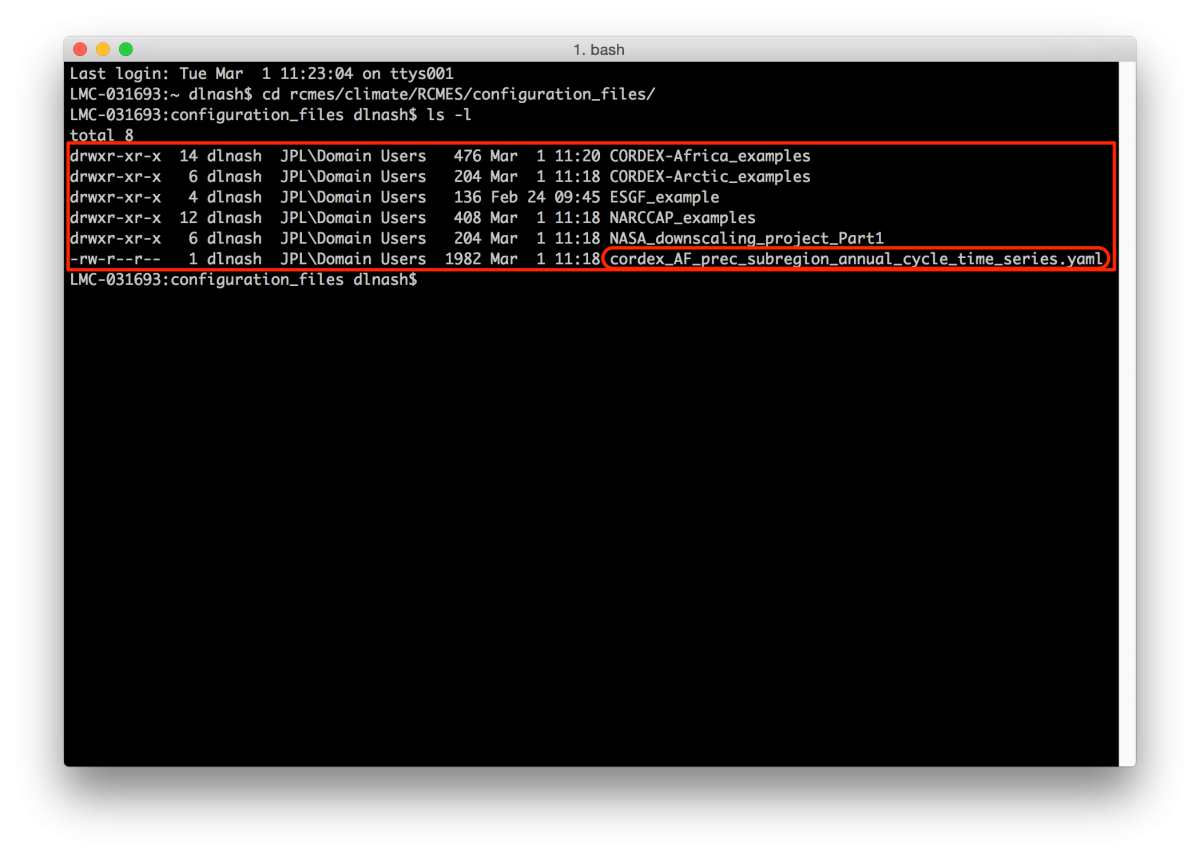
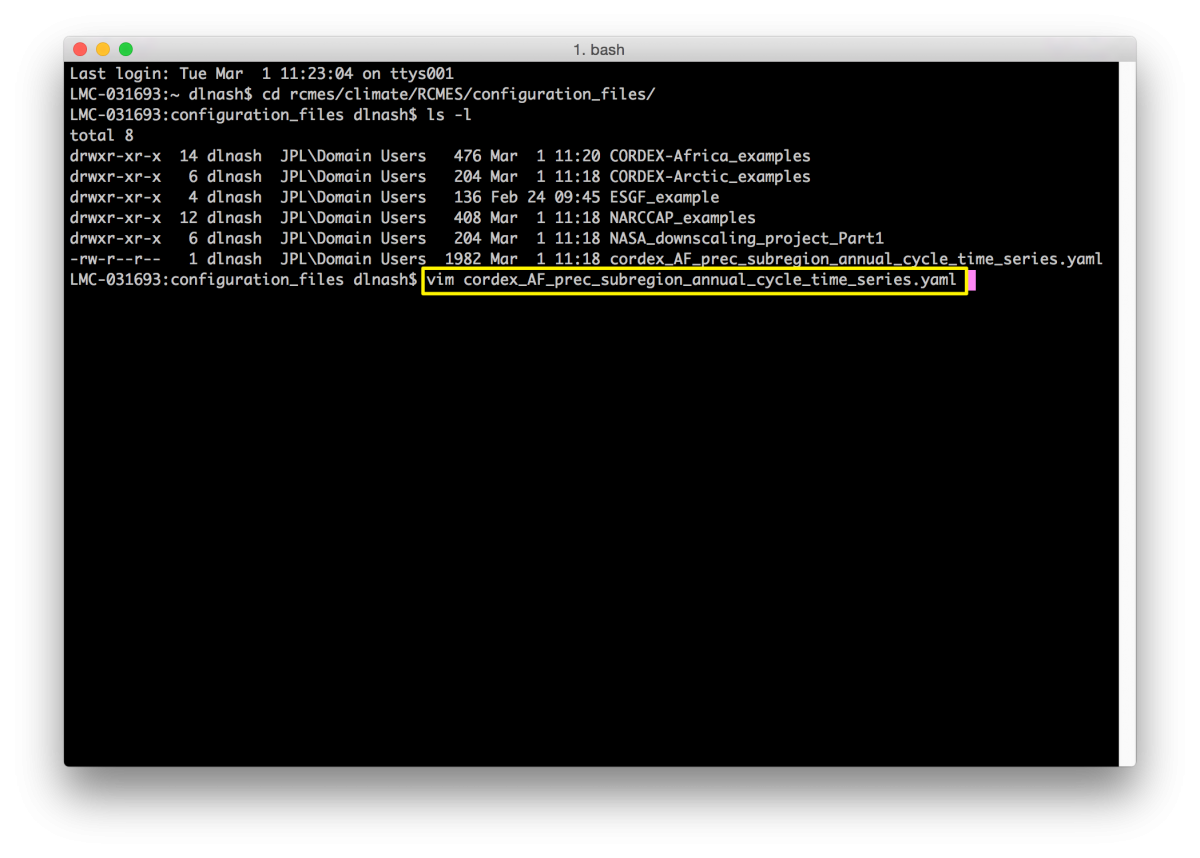
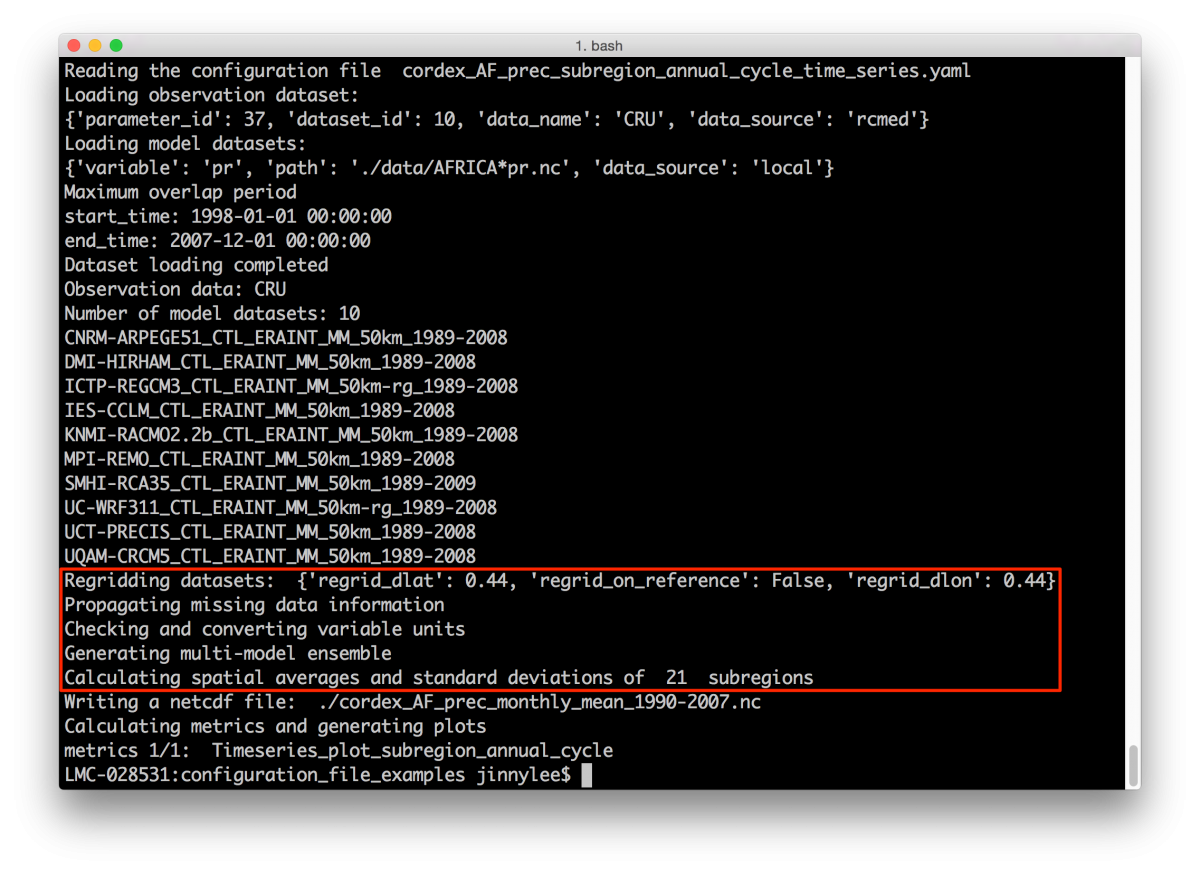
Editing the Configuration File
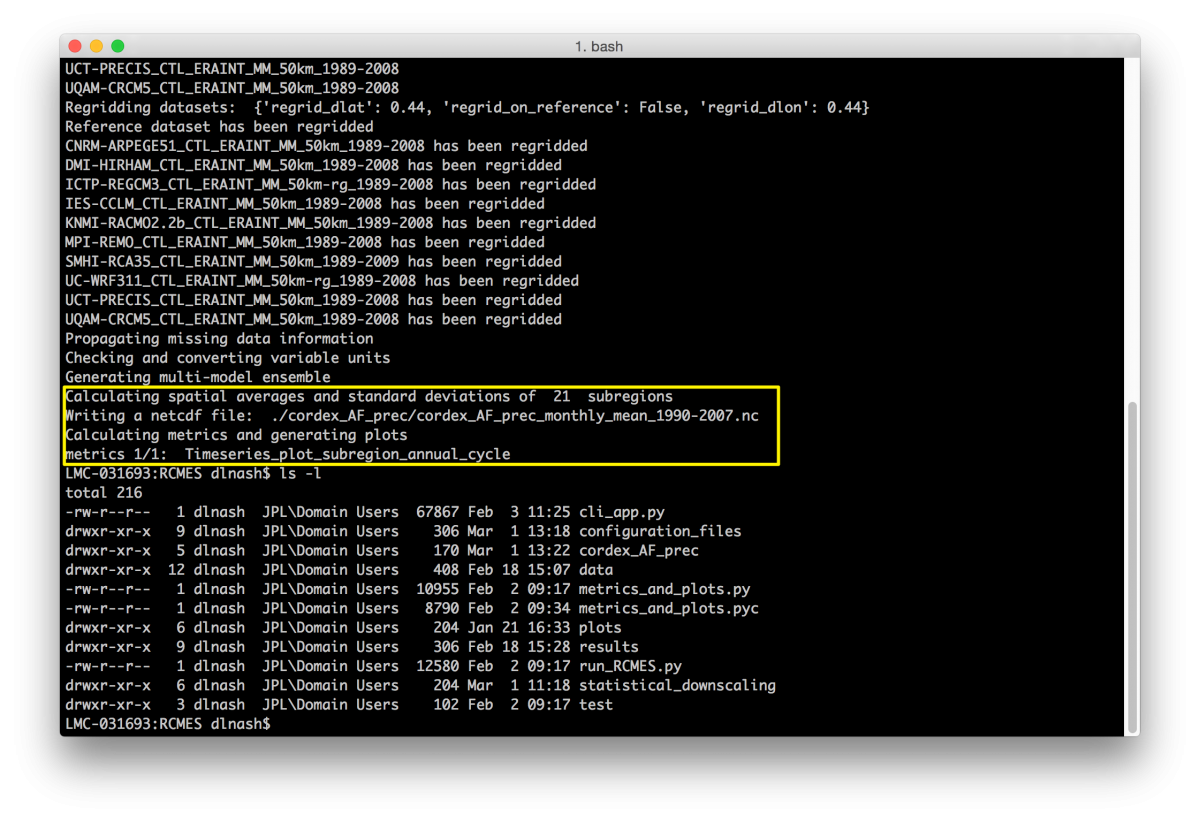
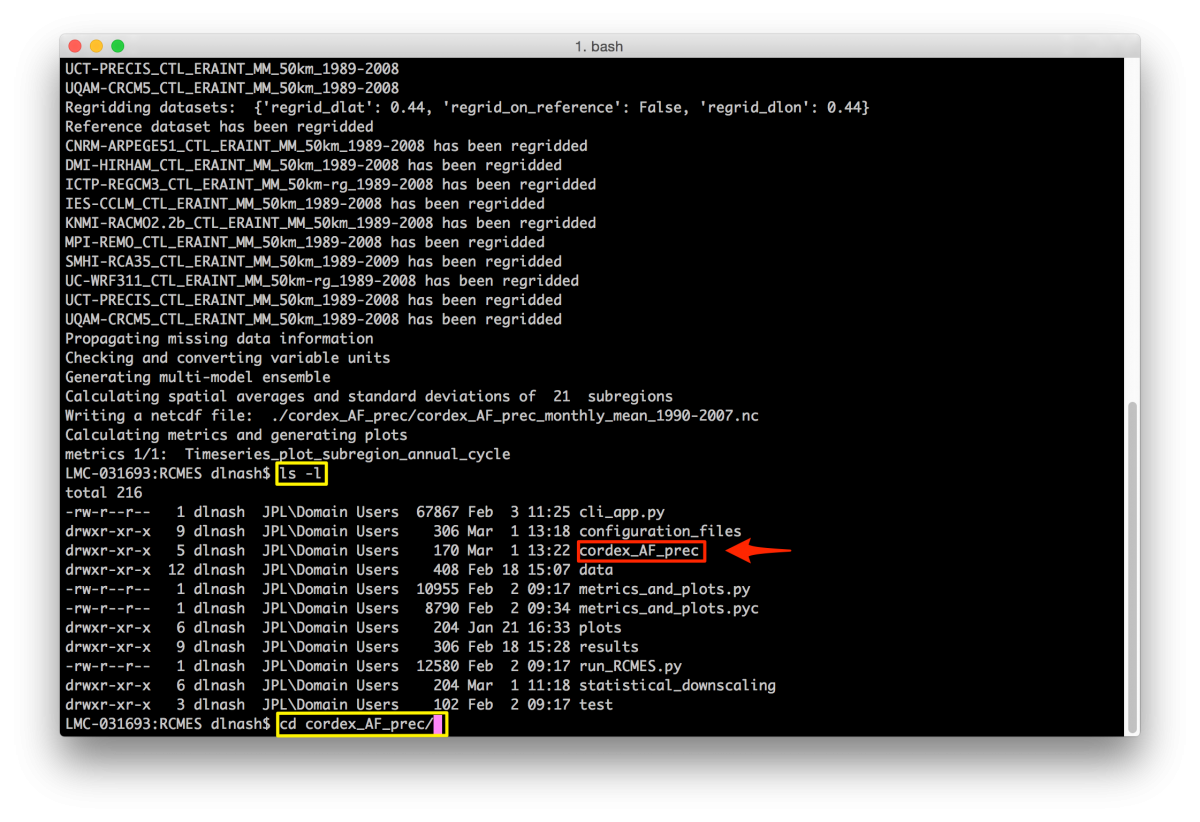
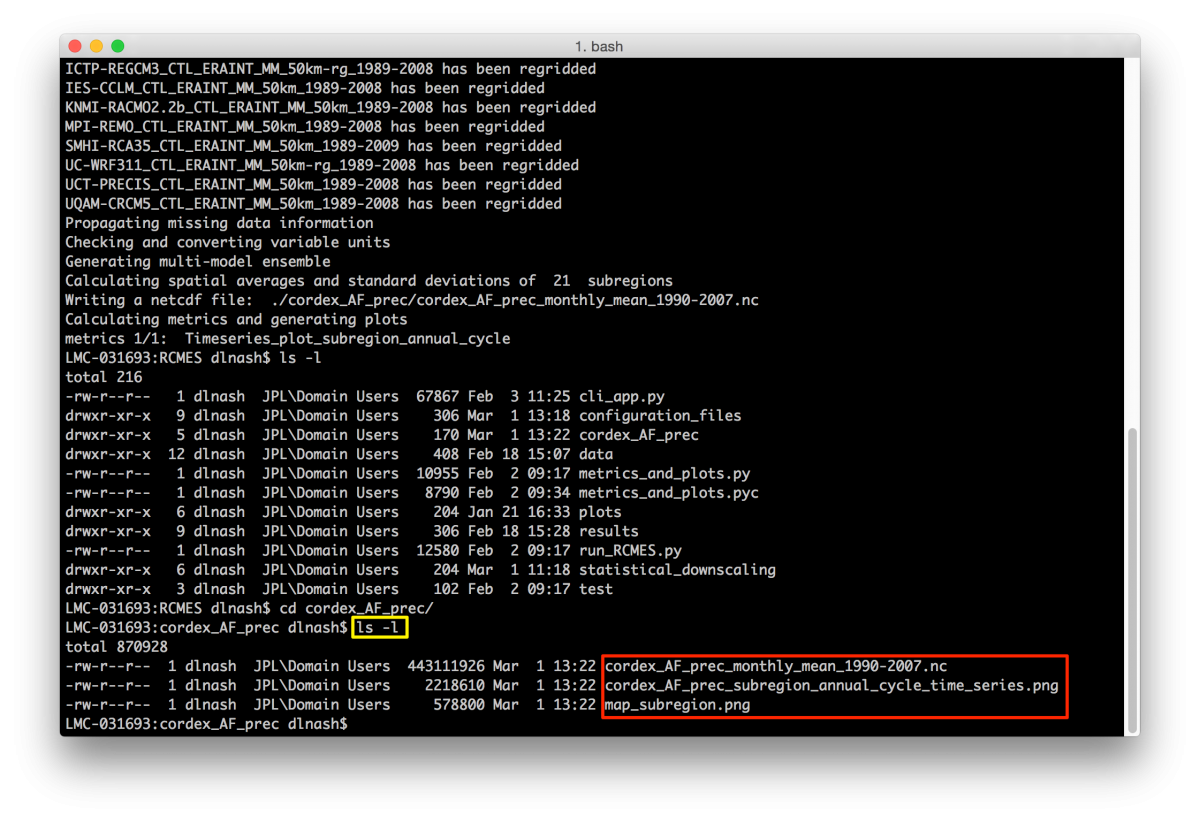
Alternatively, you can navigate to the working directory inside your OS to see the created file and plots.
If you are working in a VM environment, and want to move your results to the folder shared with your host machine, follow the directions in Step 3 of Section VI of the Running the RCMES Virtual Machine Tutorial.
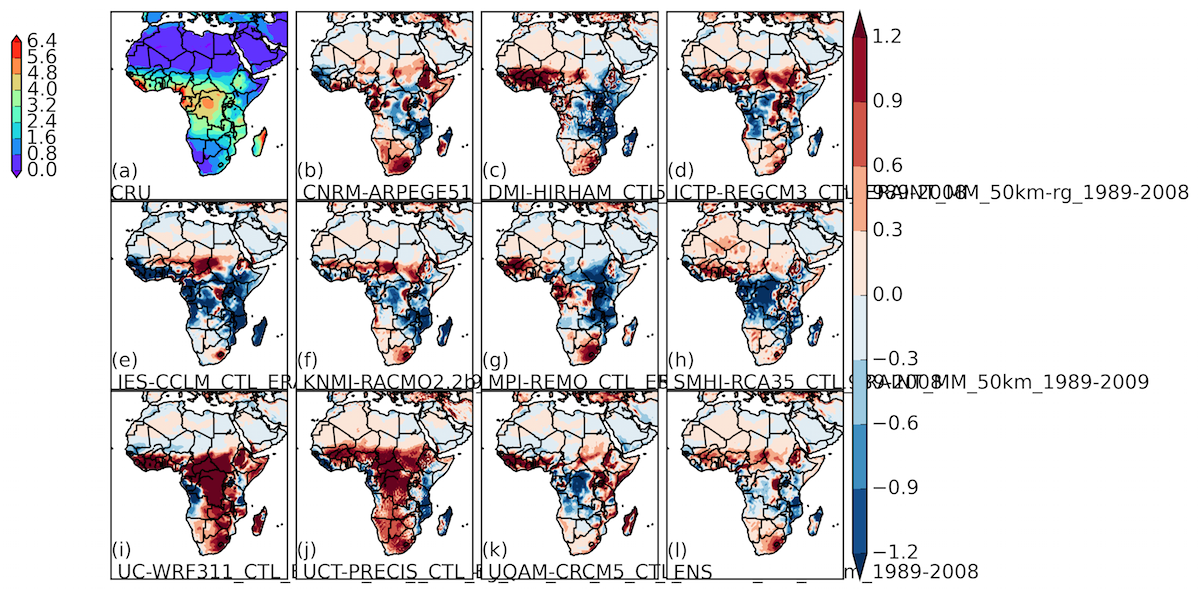
These following plots were produced by this tutorial and are found in your working directory.
(The figures from Kim et al. 2013a Cordex-Africa paper are referenced in bold with parentheses)
 |
| (Fig. 1a) The CORDEX-Africa domain and the terrain represented at a 0.44 degree resolution where the numbered boxes with white boundaries indicate the 21 sub-regions in which the area-mean time series are evaluated |
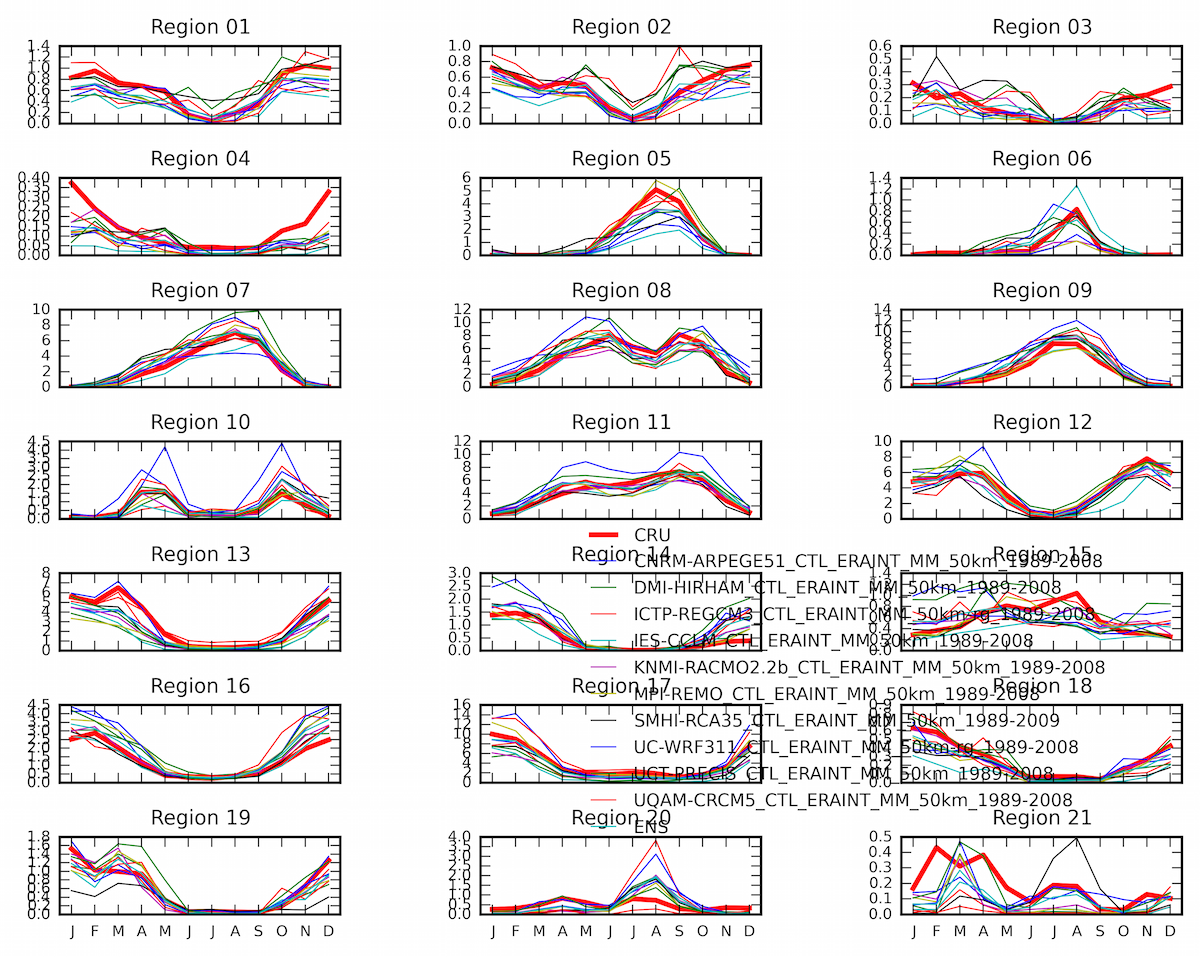 |
| (Fig. 5) The simulated precipitation annual cycle (mm/day) in the 21 sub-regions |
Helpful Tips
-
Pressing tab in the Terminal will autocomplete file and folder names.
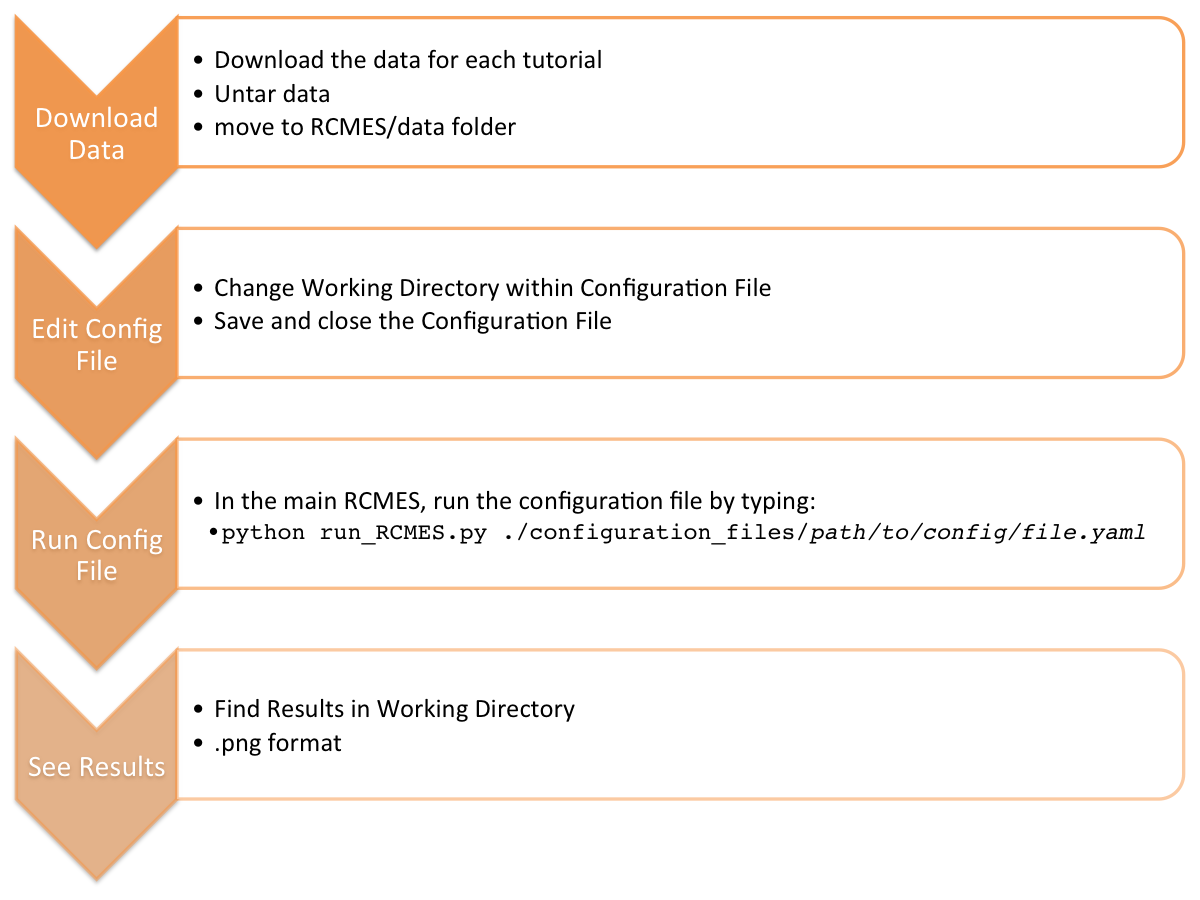
- Configuration File Workflow