RCMES is designed to perform observation-based climate model evaluation, with emphasis on regional analyses. Here we demonstrate how you can perform an end-to-end evaluation of CORDEX Africa regional climate models as published in Kim et al. (2013a). If you have not yet completed the Configuration File Training, you might want to do so now.
Quick Navigation
Download
Run Configuration Files
Precipitation
Mean Temperature
Mean Maximum Temperature
Mean Minimum Temperature
Cloud Fraction
Helpful Tips
Evaluation of CORDEX-Africa multi-RCM hindcast: systematic model errors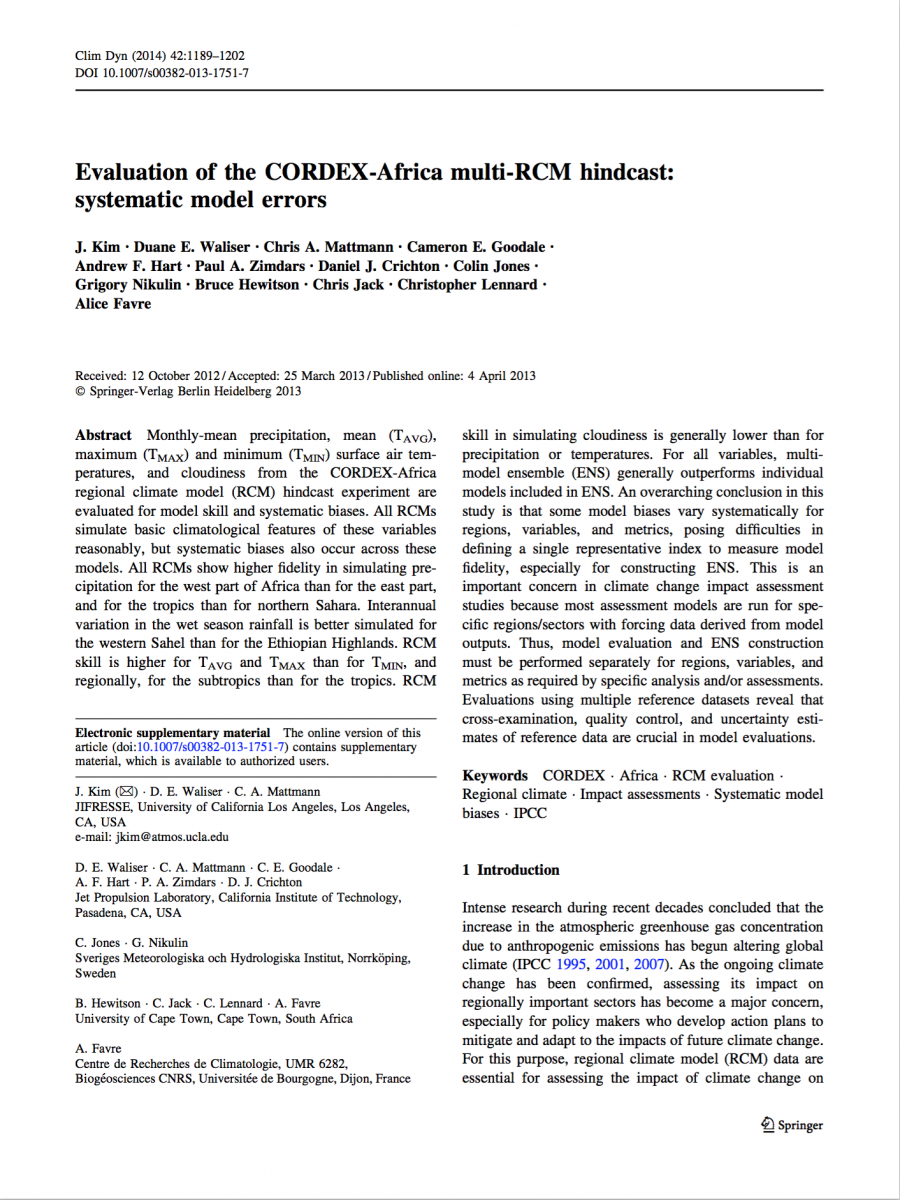
J. Kim, Duane E. Waliser, Chris A. Mattmann, Cameron E. Goodale, Andrew F. Hart, Paul A. Zimdars, Daniel J. Crichton, Colin Jones, Grigory Nikulin, Bruce Hewitson, Chris Jack, Christopher Lennard, Alice Favre
Climate Dynamics
March 2014, Volume 42, Issue 5, pp 1189-1202
DOI 10.1007/s00382-013-1751-7
First online: 04 April 2013
All of the images in this tutorial are clickable and will open in a new tab for a zoomed view.
Download
Download and Install RCMES
If you have not already done so, please go to the RCMES Download Page and install RCMES using either VM or Easy OCW.
Download Model and Observation Datasets for Tutorial
This tutorial uses model data that will need to be downloaded and saved to a specific directory within RCMES.
Next, CLICK HERE download the data for this tutorial.
If you are using VM for this tutorial, place the CORDEX-Africa_data folder within your shared data folder that you set up during the VM Install. If you have restarted your machine since the last tutorial, you will need to remount your data folder.
If you are using Easy OCW for this tutorial, you will need to save your data to an appropriate place. It is recommended that you save your data in the /climate/RCMES/data folder.
Configuration Files
The configuration files for this tutorial are found within your Configuration File Examples in a folder called CORDEX_Africa.
In your terminal, navigate to the CORDEX-Africa_examples folder.
cd rcmes/climate/RCMES/configuration_files/CORDEX-Africa_examples
Type the following to see all of the example config files in the folder.
ls -lIf you are having difficulty, please refer to the Configuration File Training for help.
The following directions will help you edit the working directory so that your results are saved in one directory when you run the configuration files.
Run Configuration Files
Precipitation Configuration Files
Fig1_2_4a_5 Config File
Using Fig1_2_4a_5.yaml and the skills learned in the Configuration File Training, edit each configuration file to change the Working Directory. In a text editor, change the working directory to where you want your results to be saved. A sample is shown below:
workdir: ./CORDEX-AF_results
You may also need to change your Target Dataset Path, depending on where you saved your data. If it is in a folder named data within the RCMES folder, then you will be able to leave the pre-loaded target dataset path. Otherwise, change the directory to where your data is stored.
Save and close your editor. You can now run the configuration file example. In the Terminal application, navigate to the folder containing the RCMES and execute the program by inputting:
RCMES will output the progress of the analysis on the screen. The following plots were produced by this tutorial and can be found in your working directory.
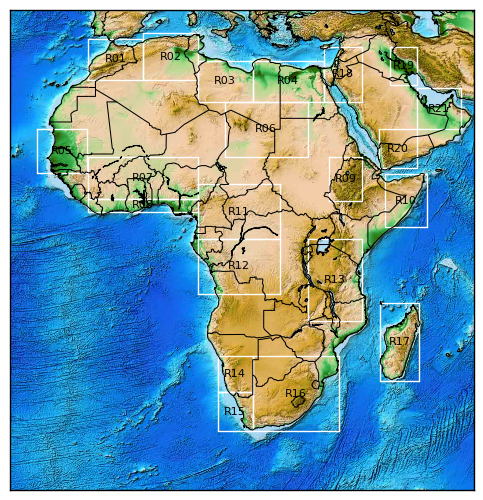 |
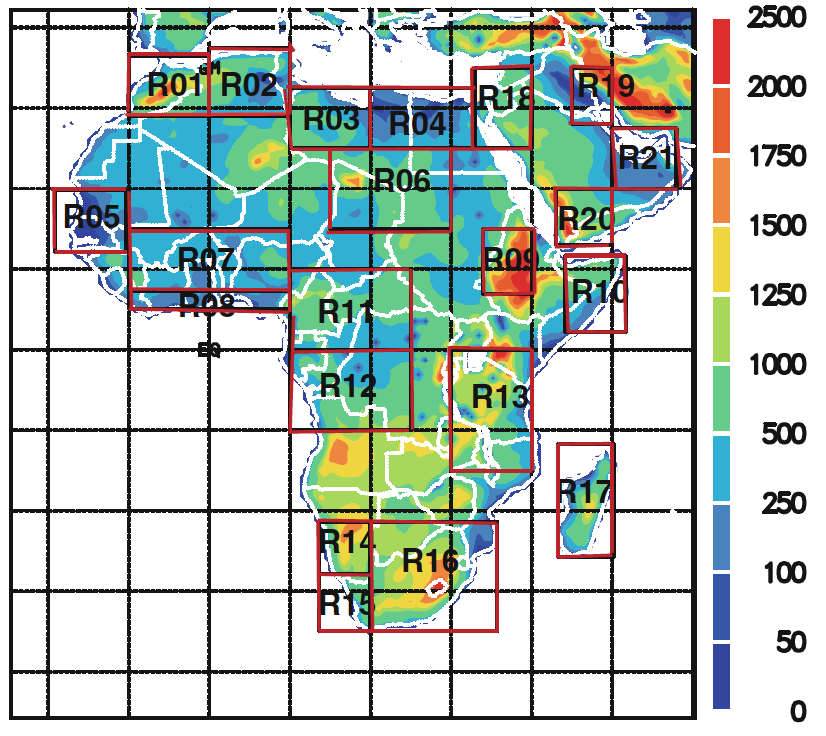
| (Fig. 1a) The CORDEX-Africa domain and the terrain represented at a 0.44 degree resolution where the numbered boxes with white boundaries indicate the 21 sub-regions in which the area-mean time series are evaluated. |
 |
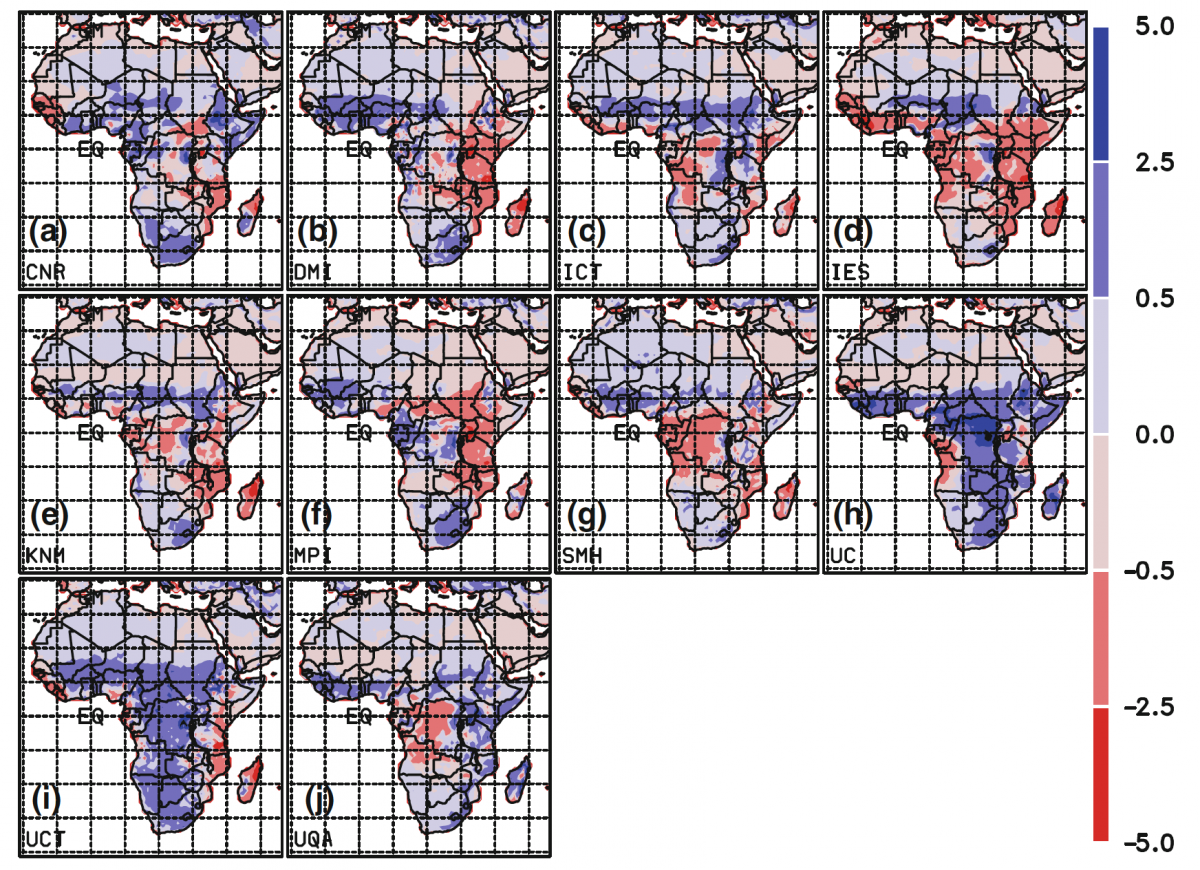
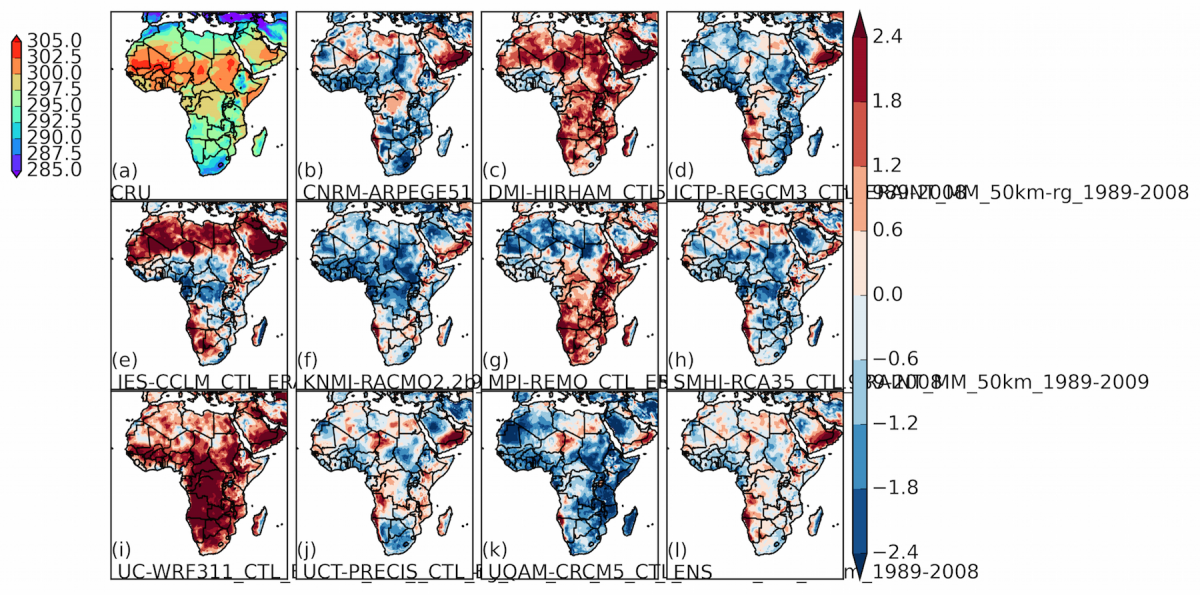
| (Fig. 1b & Fig. 2a-j) The biases in the simulated annual-mean precipitation (mm/day) against the CRU data for the individual models. |
 |
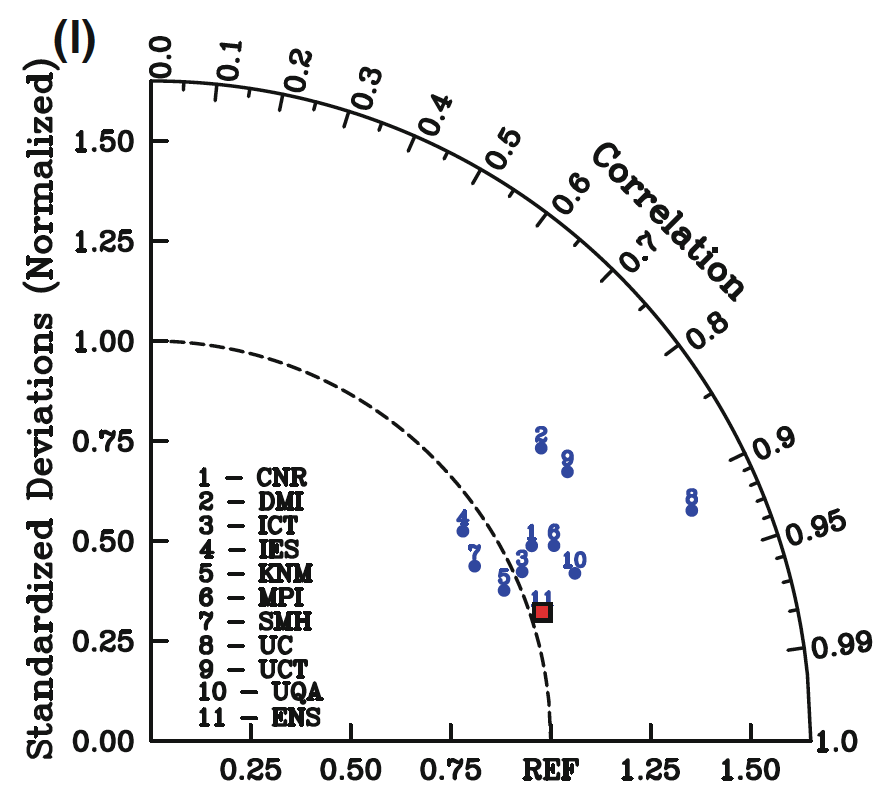
| (Fig. 2l) The spatial pattern correlations and standard deviations with respect to the CRU data over the land surface. |
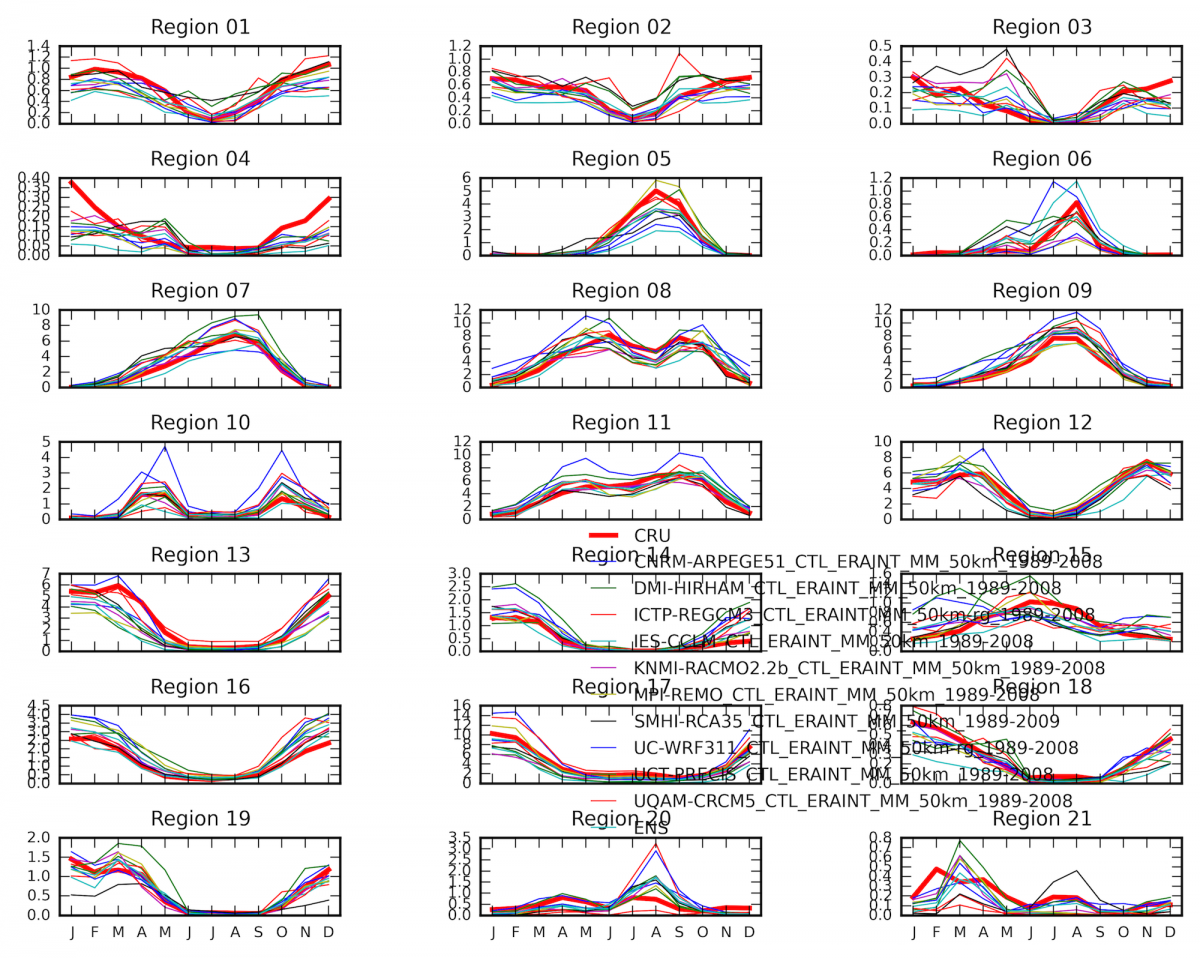 |
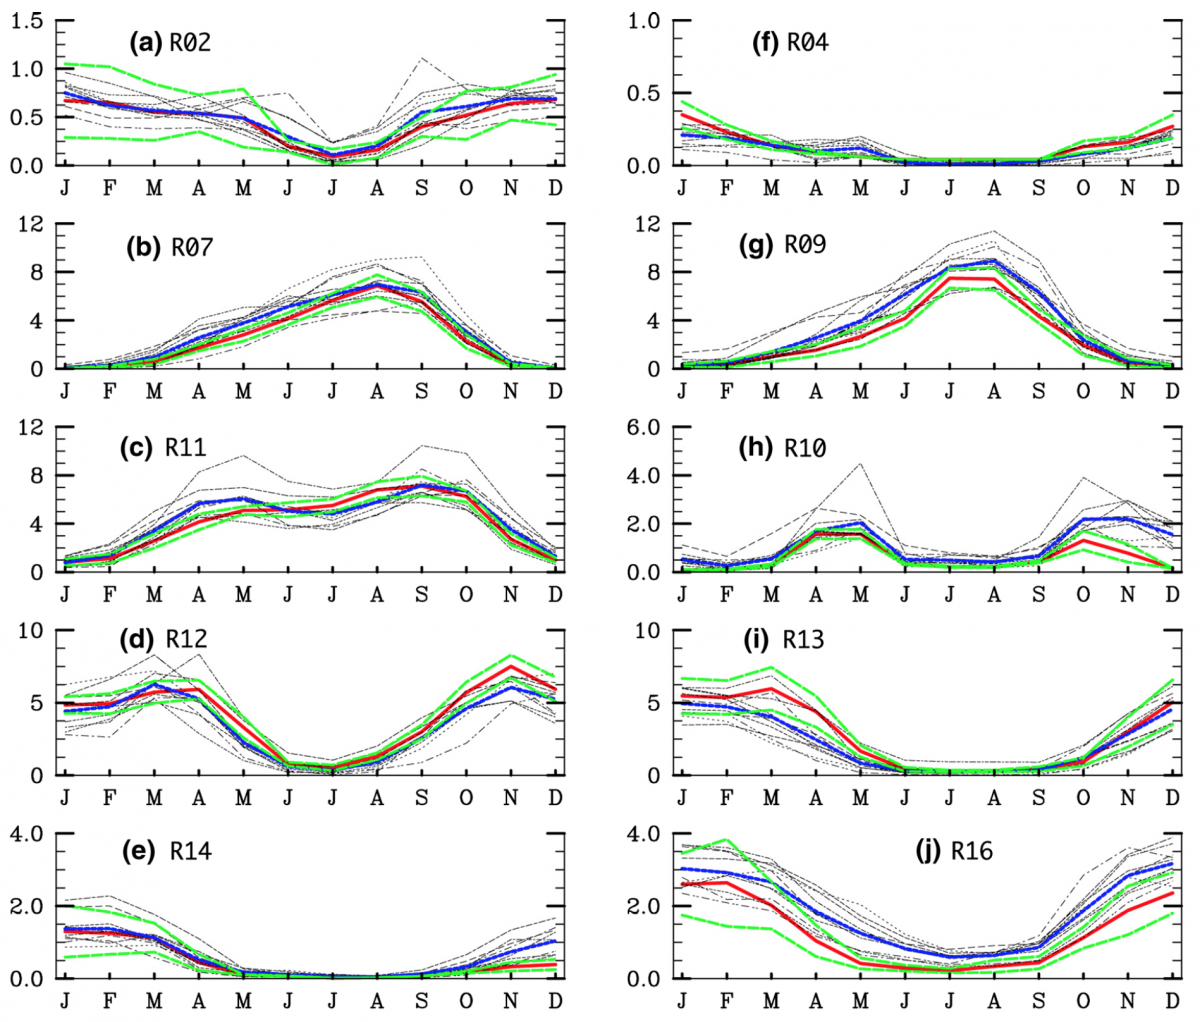
| (Fig. 5a-j) The simulated precipitation annual cycle (mm/day) in the subregions. |
Fig3a_summer & Fig 3a_winter Config Files
Edit Fig3a_summer.yaml and Fig3a_winter.yaml files to change the working directory. Make sure you are in the RCMES folder and run the following:
python run_RCMES.py configuration_files/CORDEX-Africa_examples/Fig3a_summer.yaml
and
python run_RCMES.py configuration_files/CORDEX-Africa_examples/Fig3a_winter.yaml
The following results are found within your working directory.
 |
 |
|
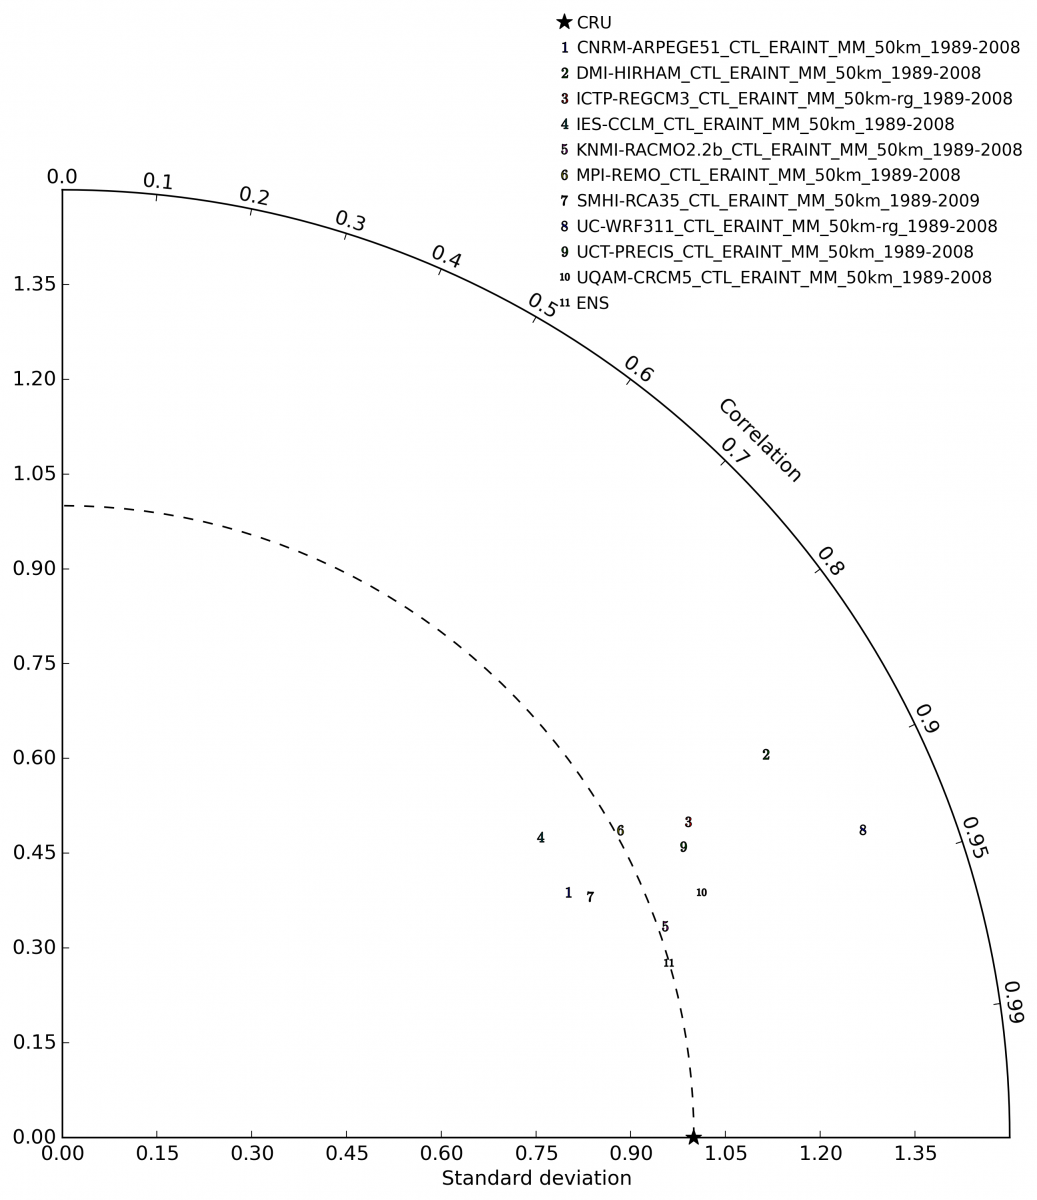
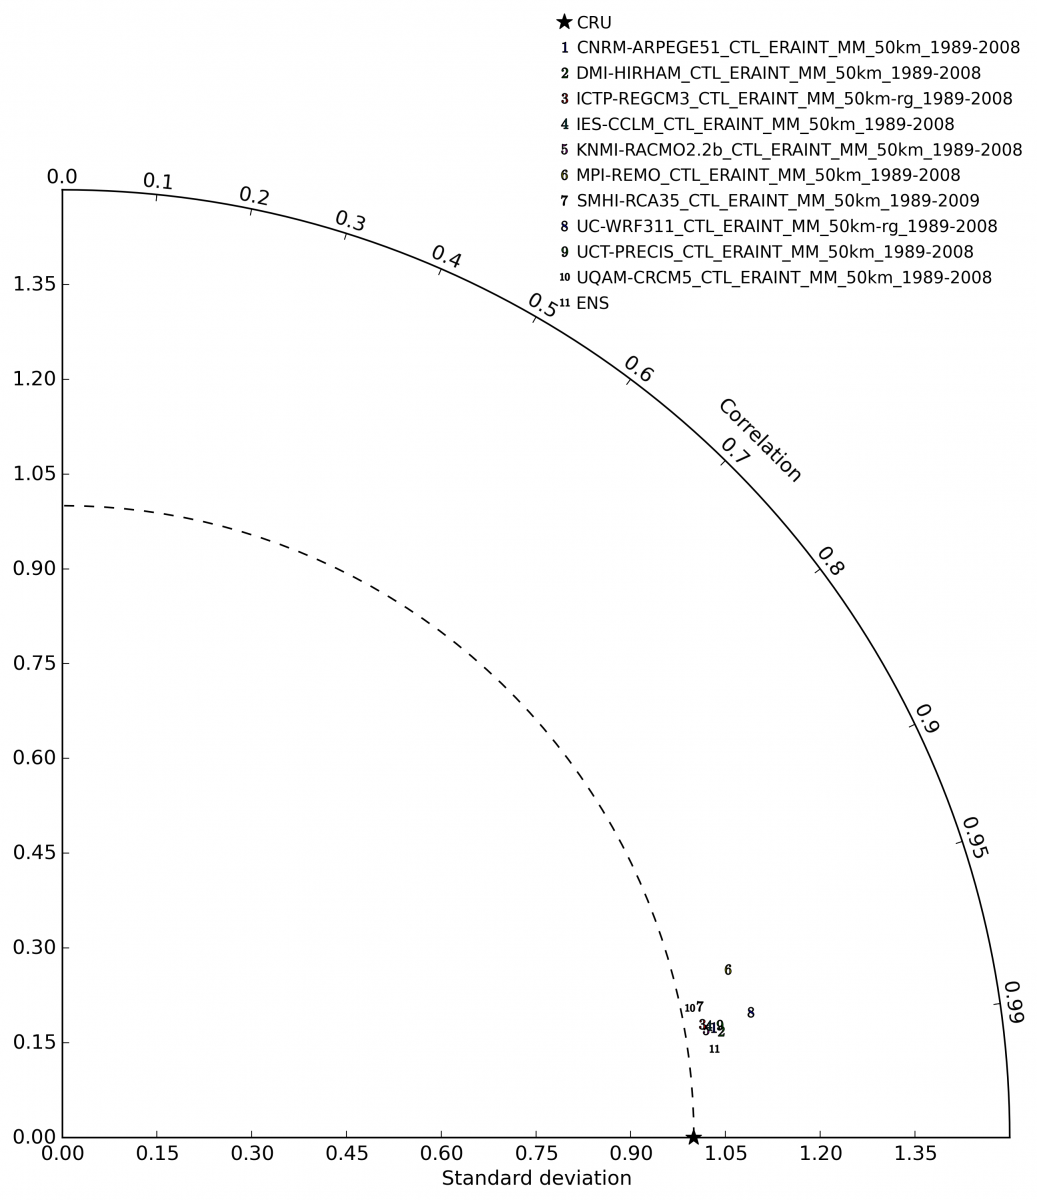
| (Fig. 3a Summer) The standardized deviations and spatial pattern correlations between the CRU data and the individual model results of precipitation for the boreal summer (June-July-August) over the land surface. | (Fig. 3a Winter) The standardized deviations and spatial pattern correlations between the CRU data and the individual model results of precipitation for the winter (December-January-February) over the land surface. |
Fig10b_cru Config File
Edit the Fig10b_cru.yaml file to change the working directory. Make sure you are in the RCMES folder and run the following:
python run_RCMES.py configuration_files/CORDEX-Africa_examples/Fig10b_cru.yaml
The following results are found within your working directory.
 |
| (Fig. 10b CRU) Evaluation of the simulated precipitation climatology over the land using CRU. |
Mean Temperature Configuration Files
Fig3b_summer & Fig3b_winter Config Files
Edit Fig3b_summer.yaml and Fig13b_winter.yaml files to change the working directory. Make sure you are in the RCMES folder and run the following:
python run_RCMES.py configuration_files/CORDEX-Africa_examples/Fig3b_summer.yaml
and
python run_RCMES.py configuration_files/CORDEX-Africa_examples/Fig3b_winter.yaml
The following results are found within your working directory.
 |
 |
|
| (Fig. 3b Summer) The standardized deviations and spatial pattern correlations between the CRU data and the individual model results of mean temperature for the boreal summer (June-July-August) over the land surface. | (Fig. 3b Winter) The standardized deviations and spatial pattern correlations between the CRU data and the individual model results of mean temperature for the boreal winter (December-January-February) over the land surface. |
Fig4d_7d_8ad Config Files
Edit Fig4d_7d_8ad.yaml files to change the working directory. Make sure you are in the RCMES folder and run the following:
python run_RCMES.py configuration_files/CORDEX-Africa_examples/Fig4d_7d_8ad.yaml
The following results are found within your working directory.
 |
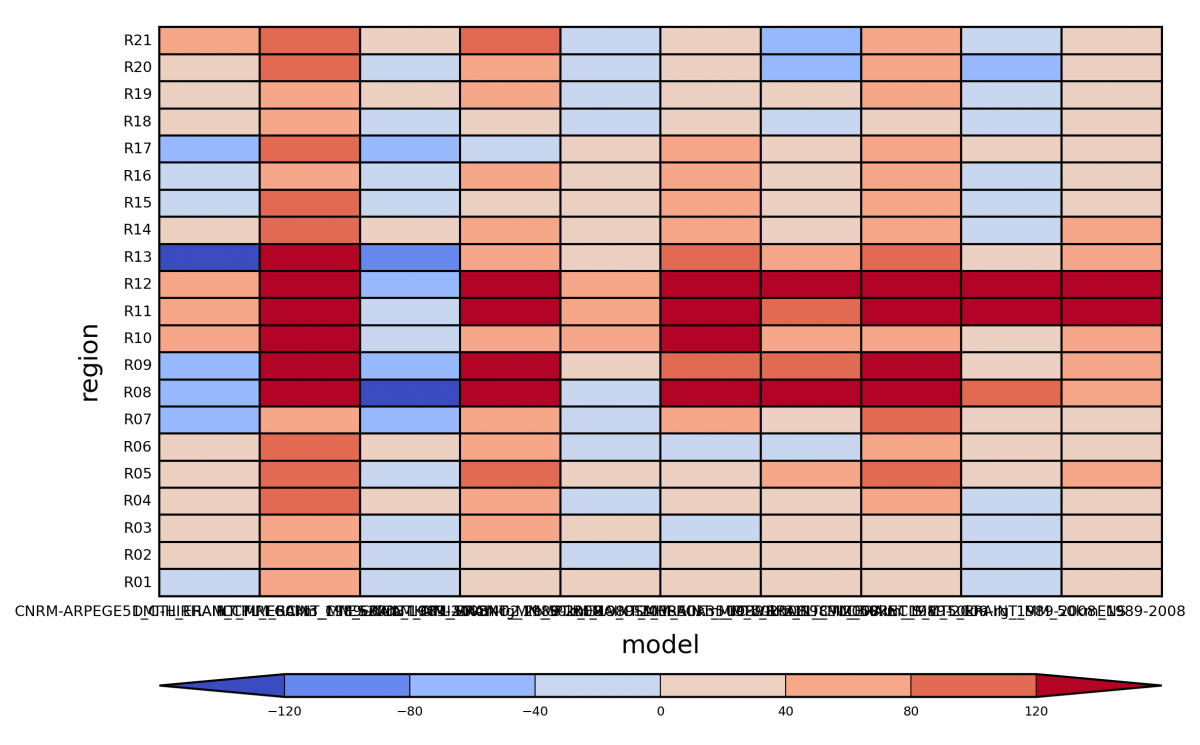
| (Fig. 4d) The biases in the simulated annual-mean temperature (K) against the CRU data for the individual models. |
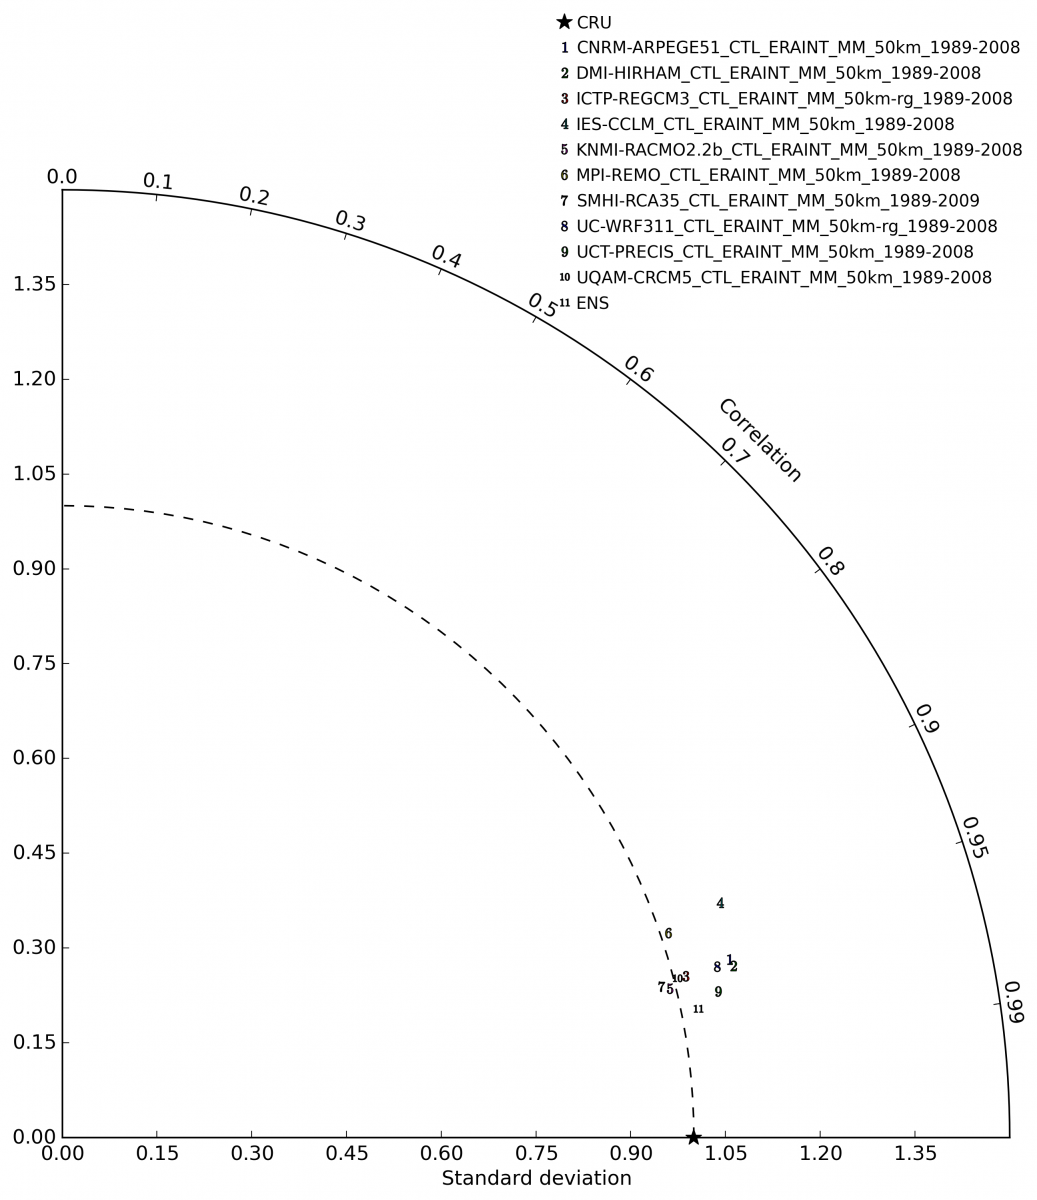 |
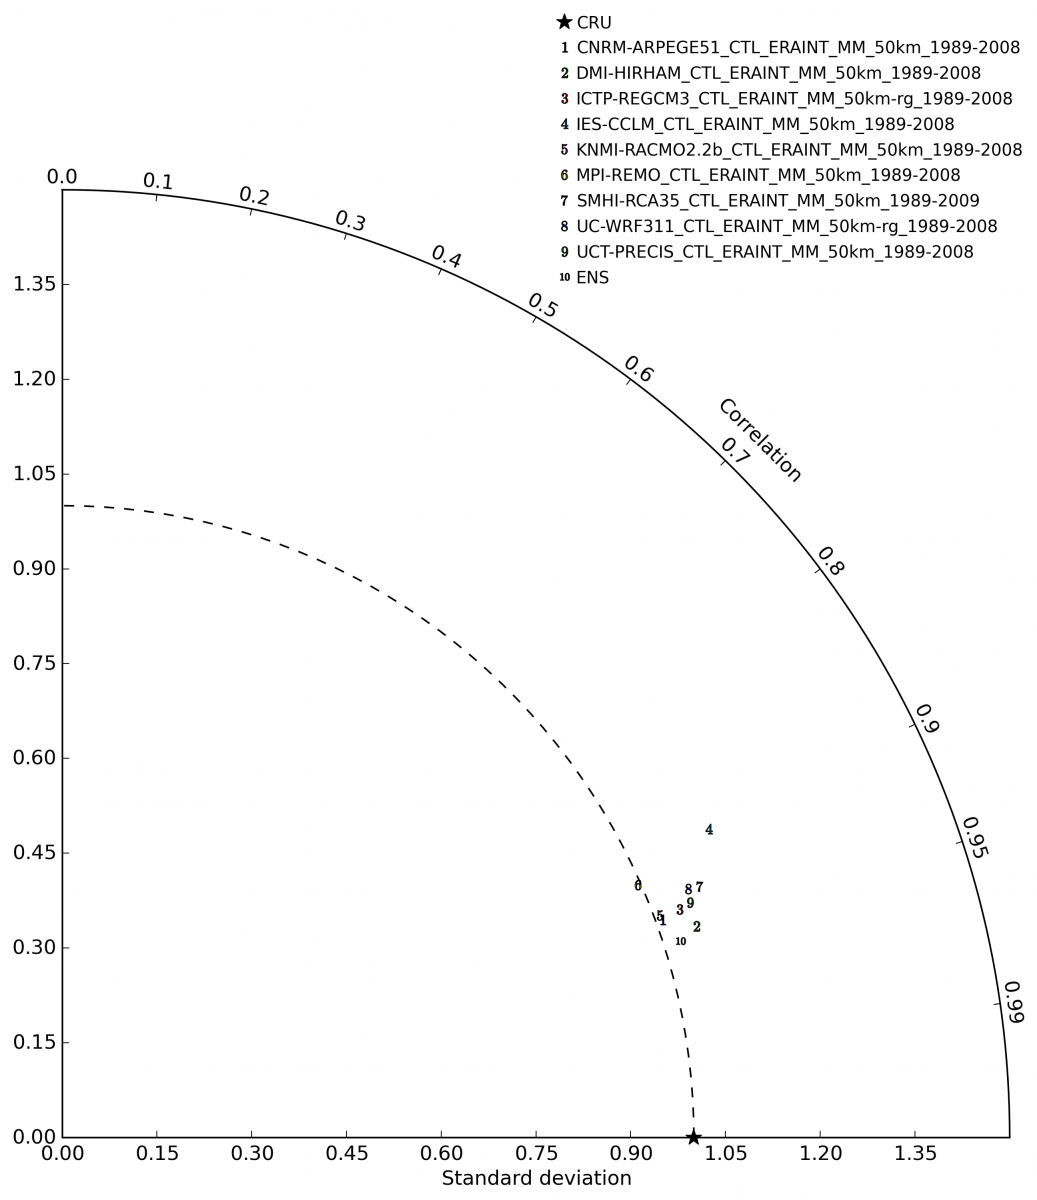
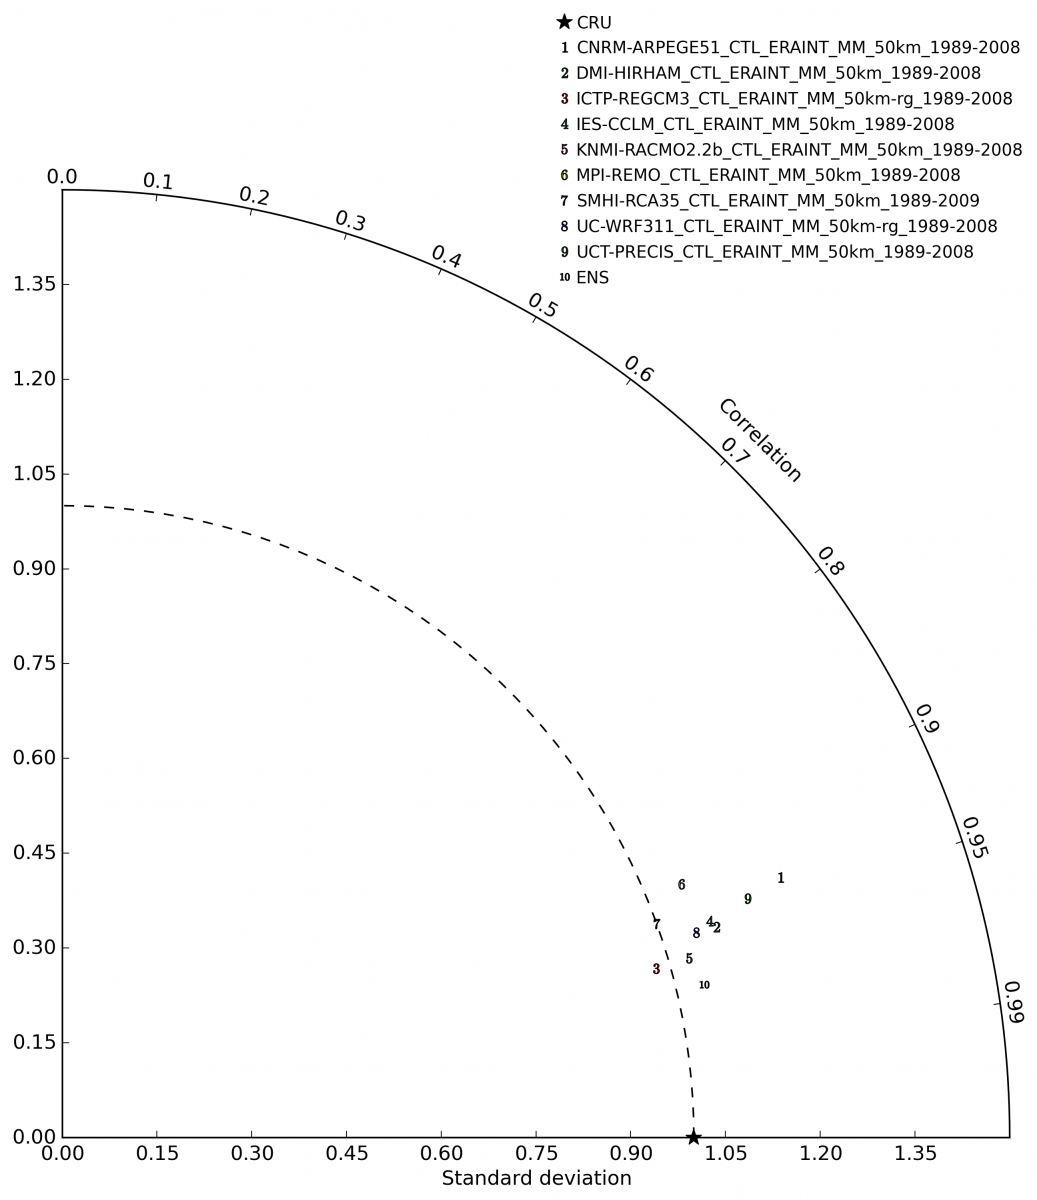
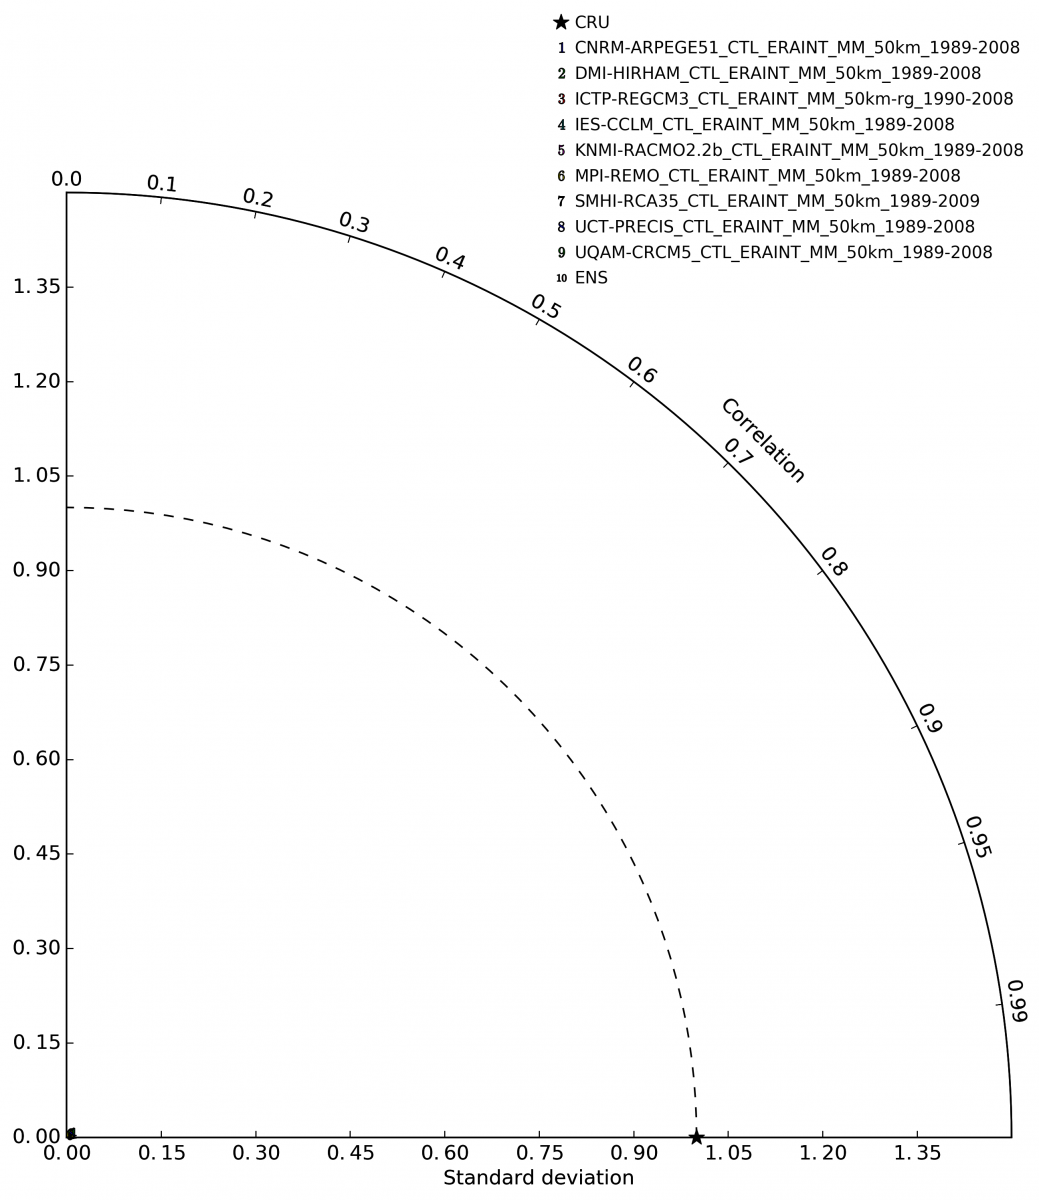
| (Fig. 7d) The evaluation of the standardized standard deviations and correlations of the simulated mean temperature. |
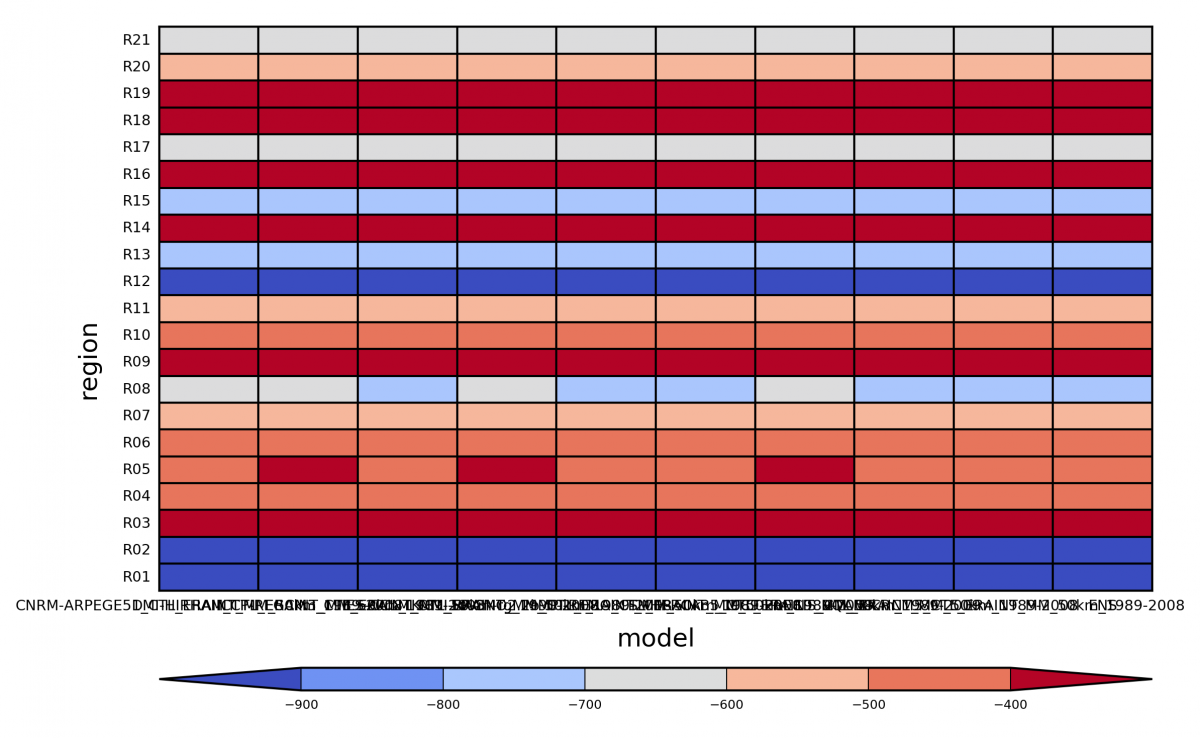
| Bias | Standard Deviation | |
 |
 |
|
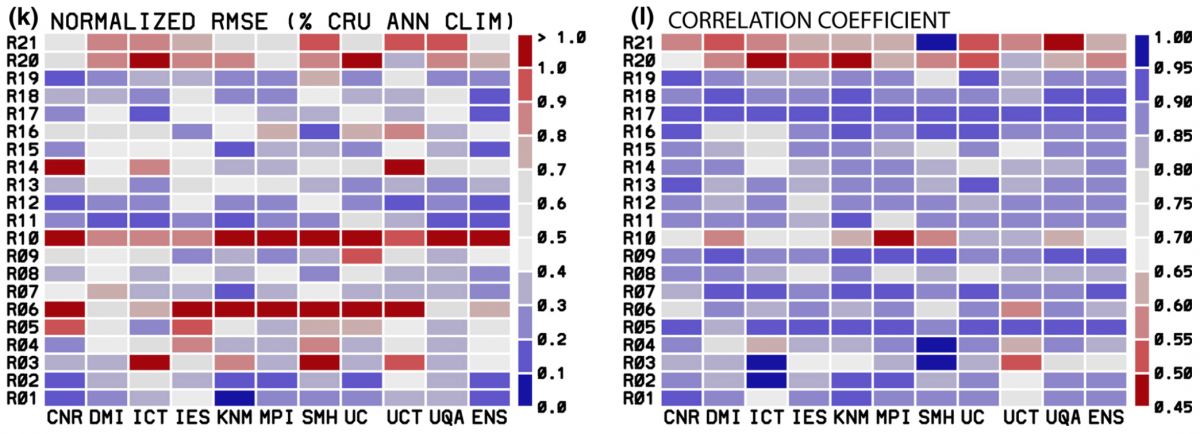
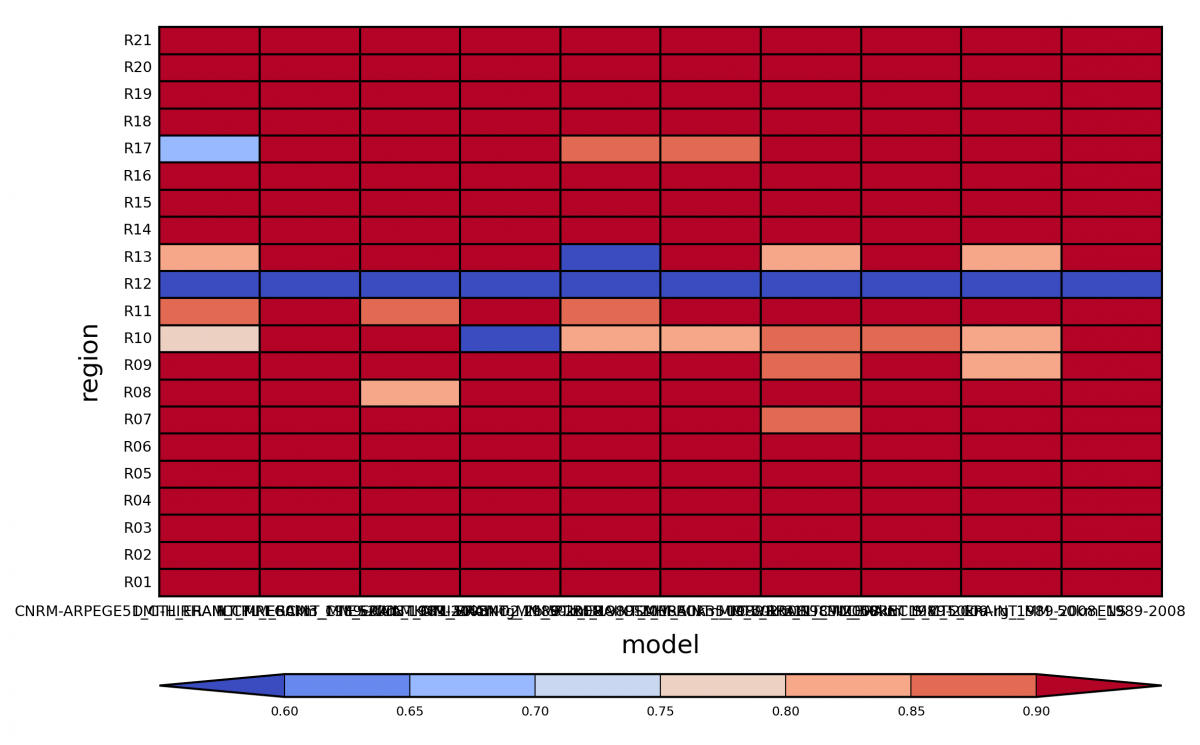
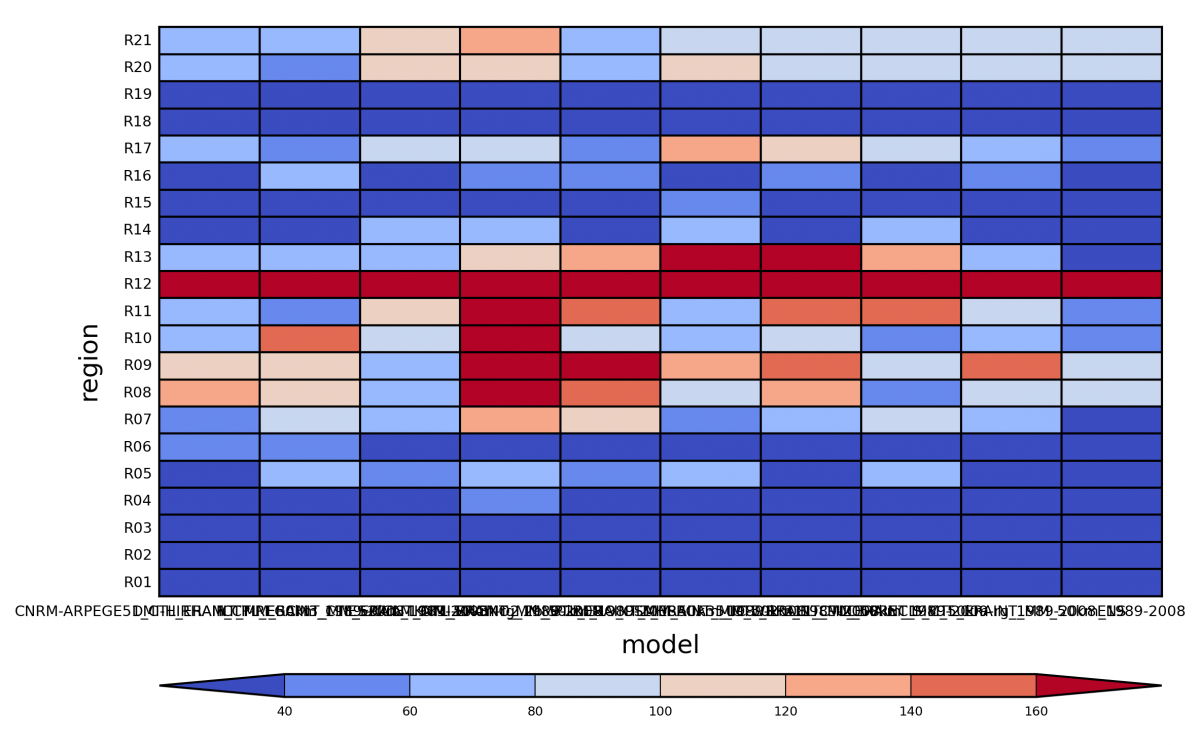
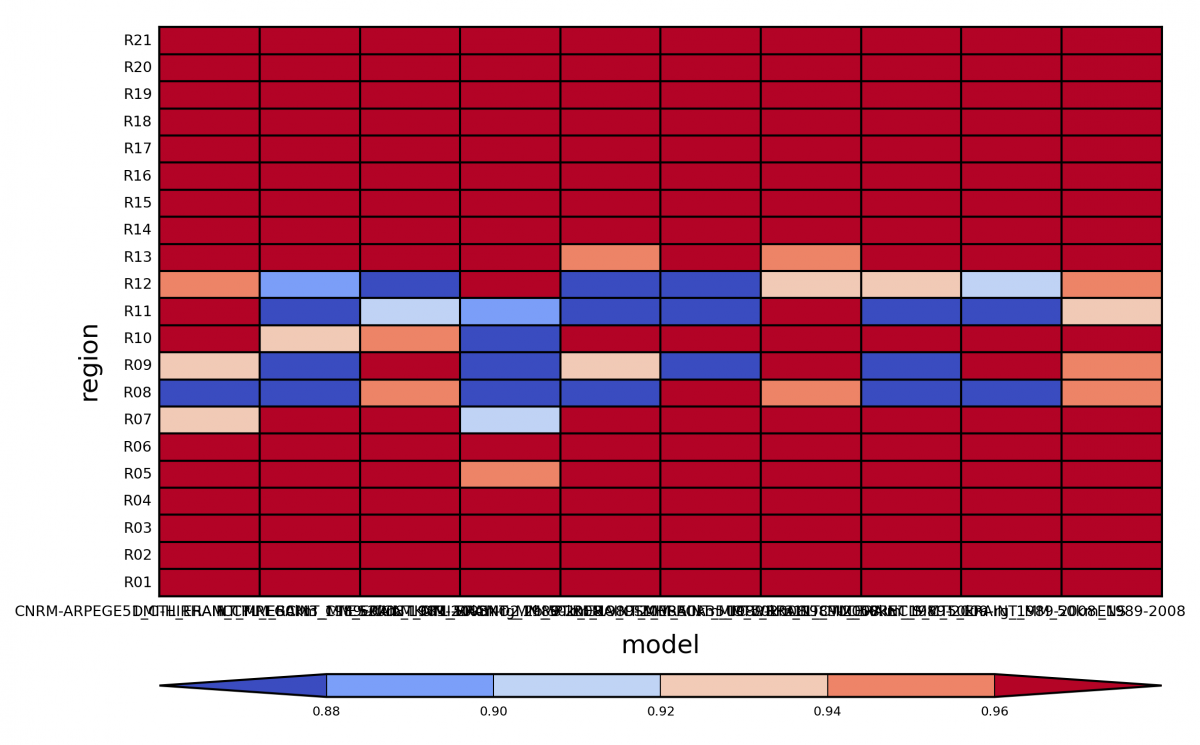
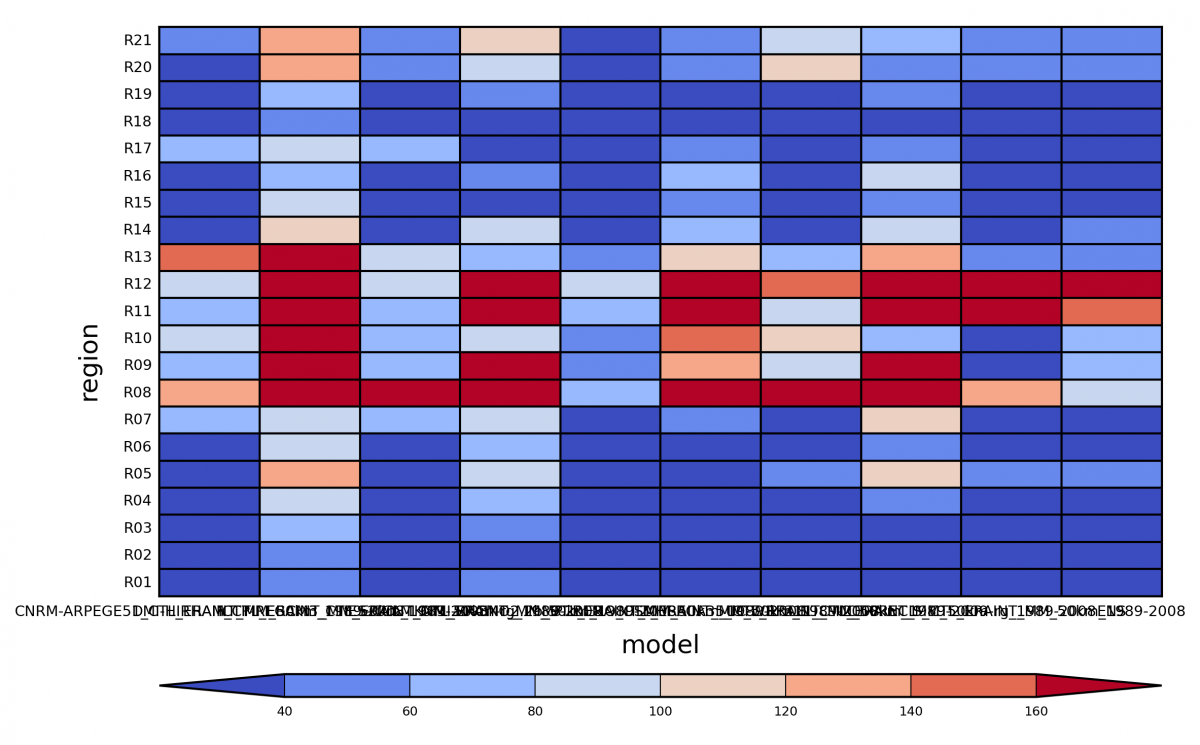
| Correlation Coefficient | RMSE | |
 |
 |
|
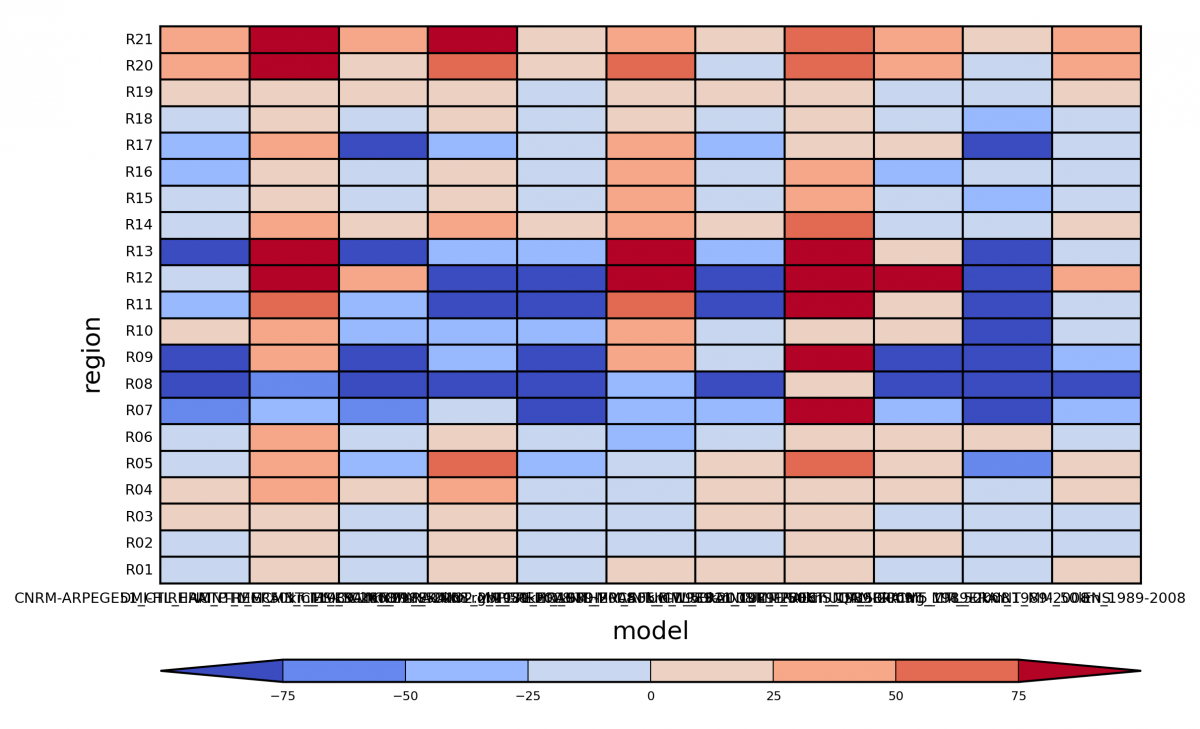
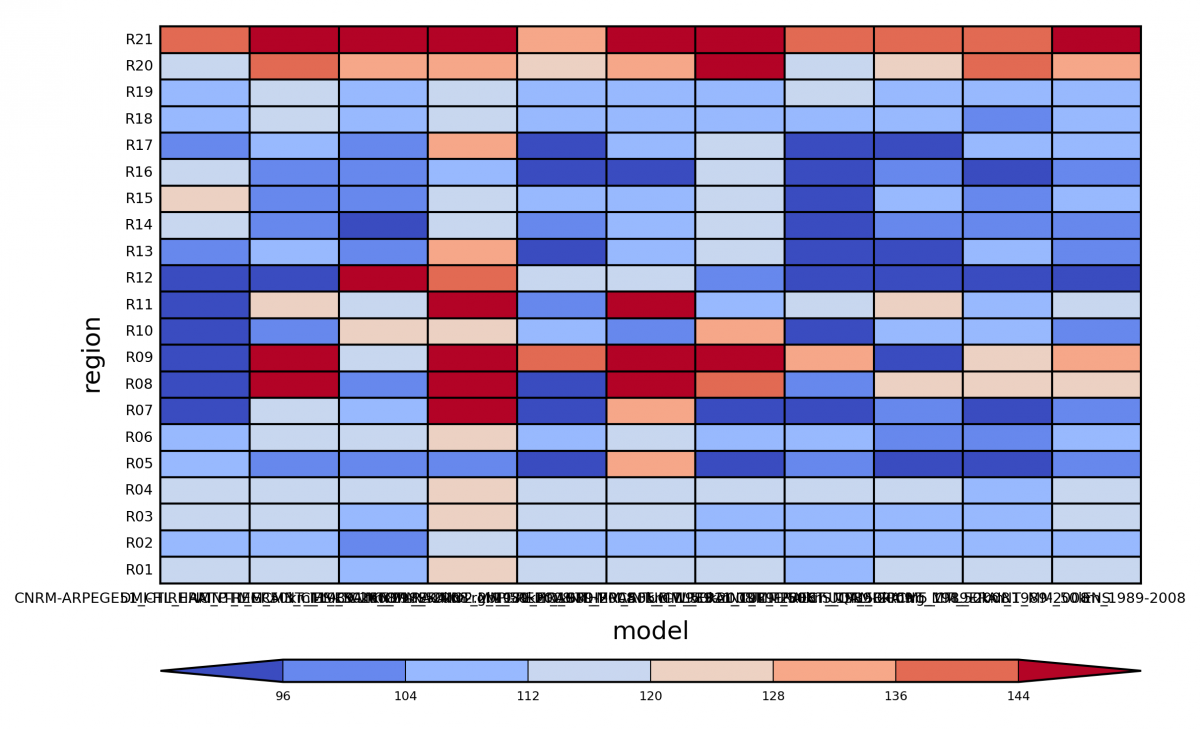
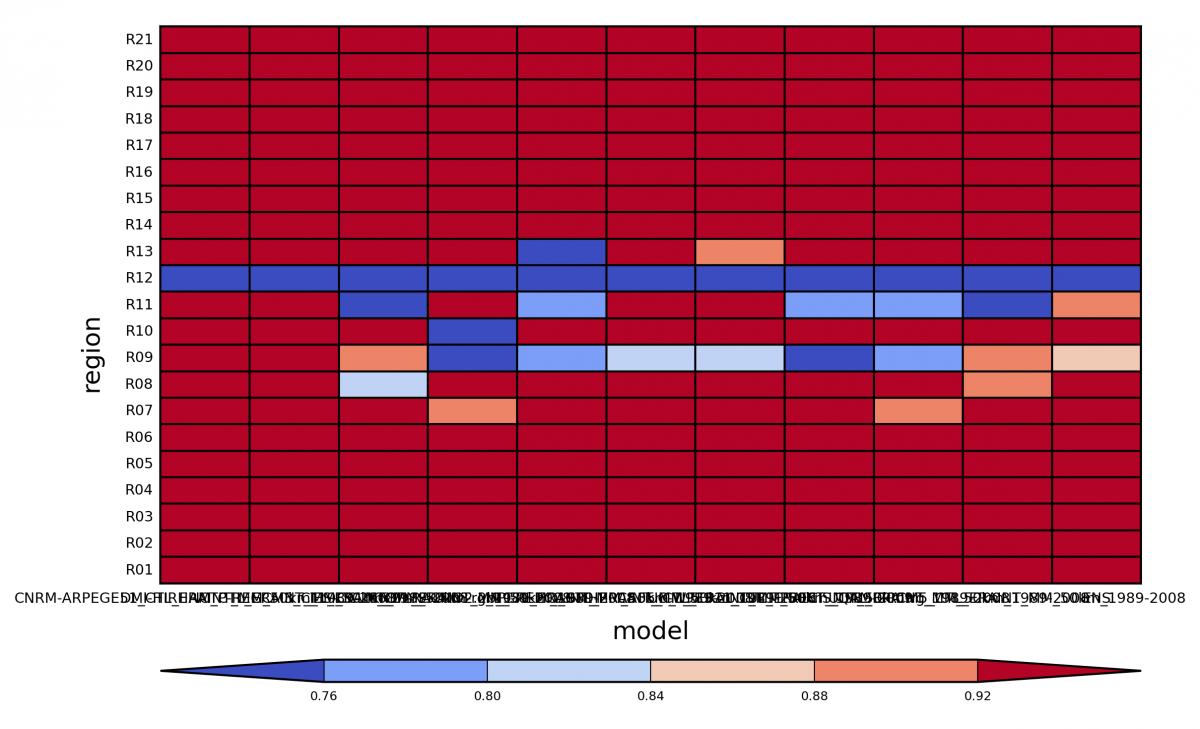
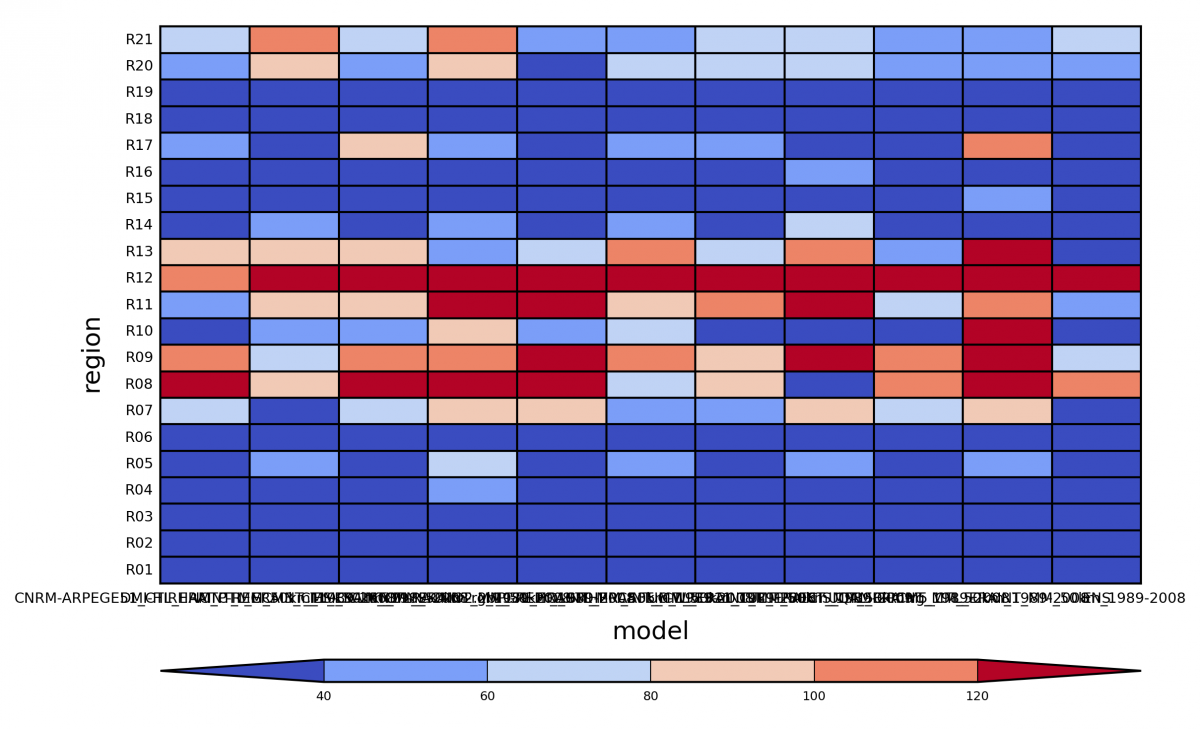
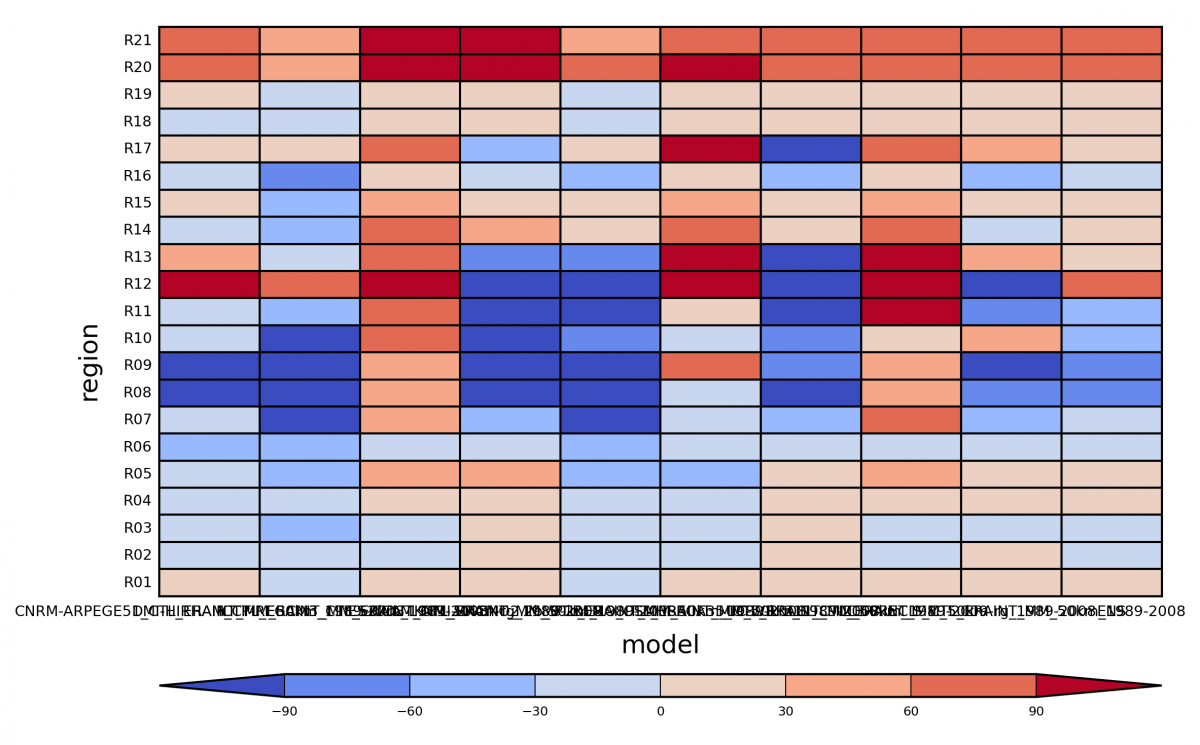
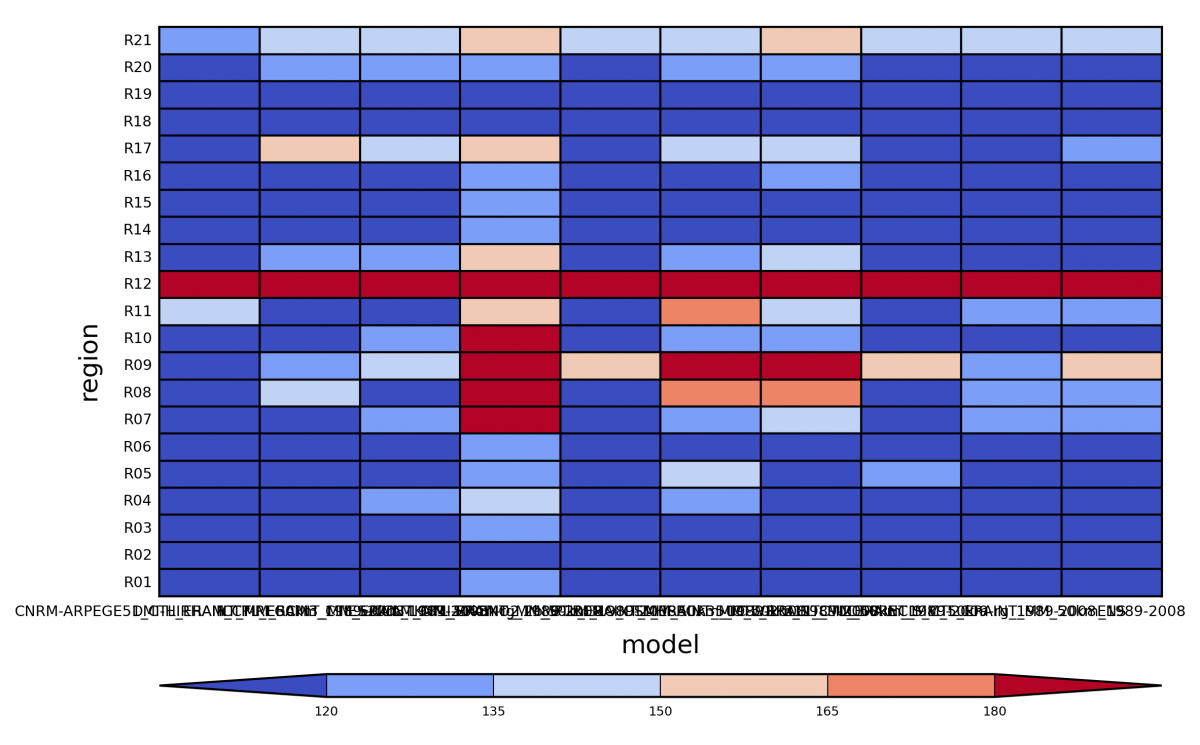
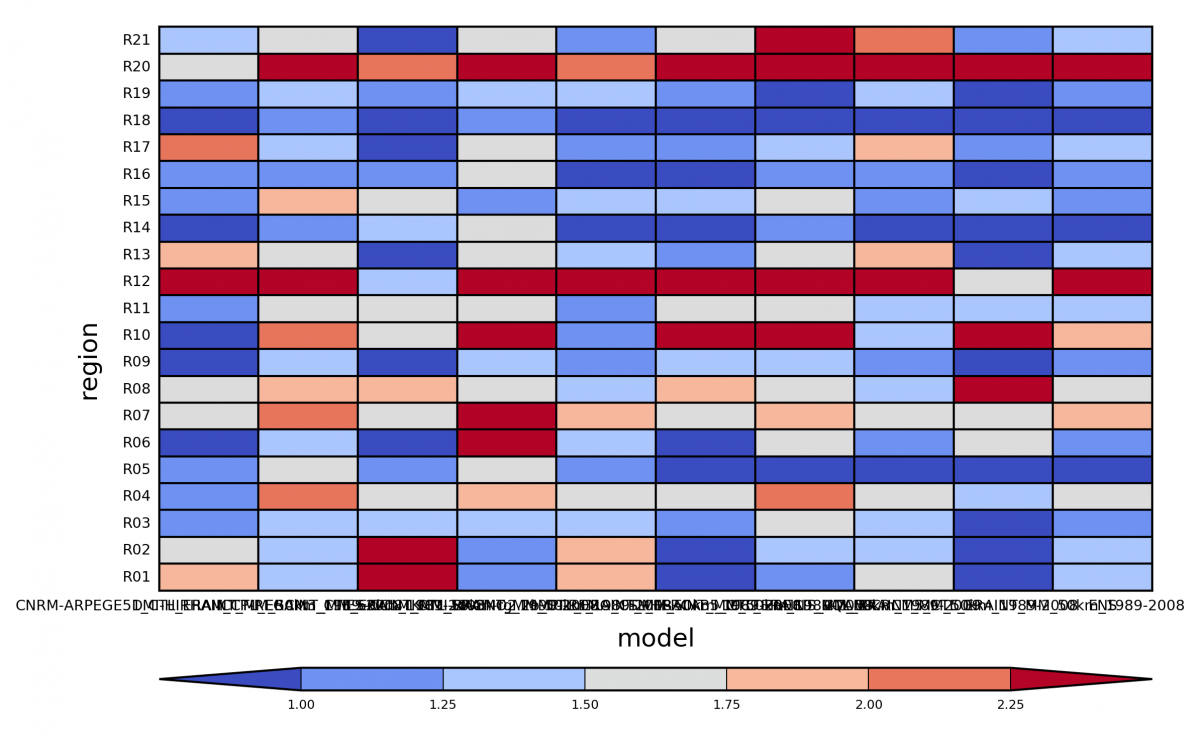
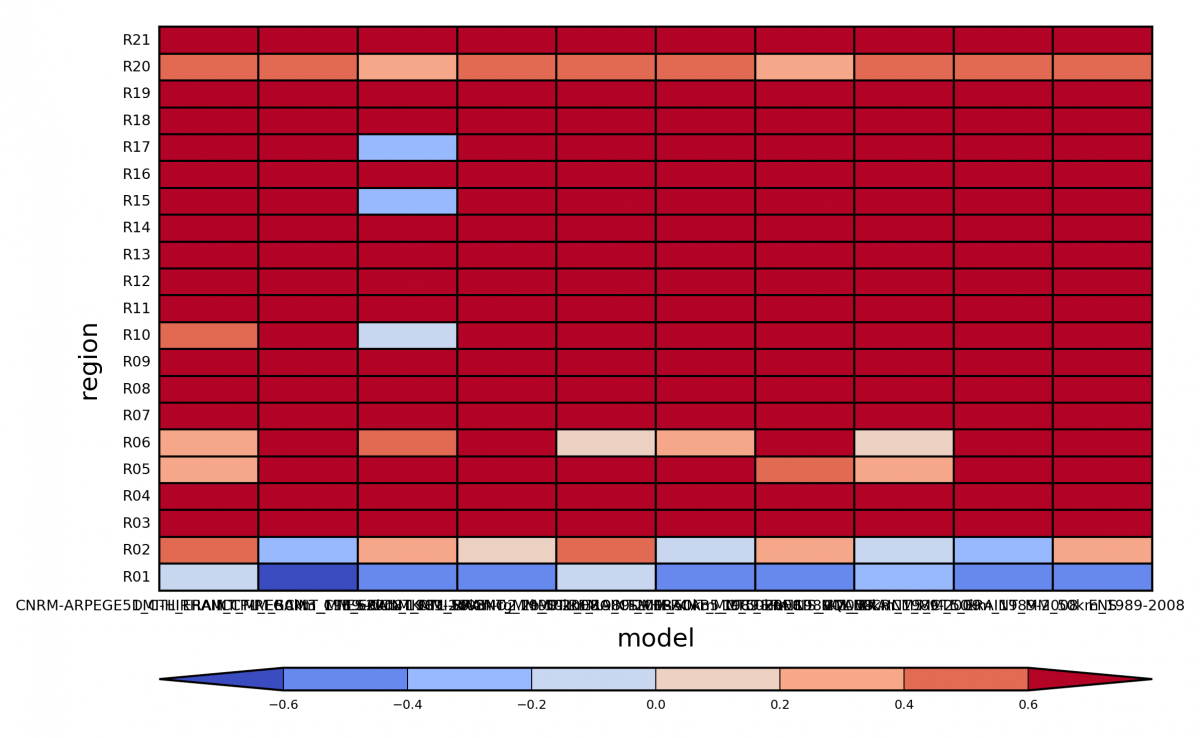
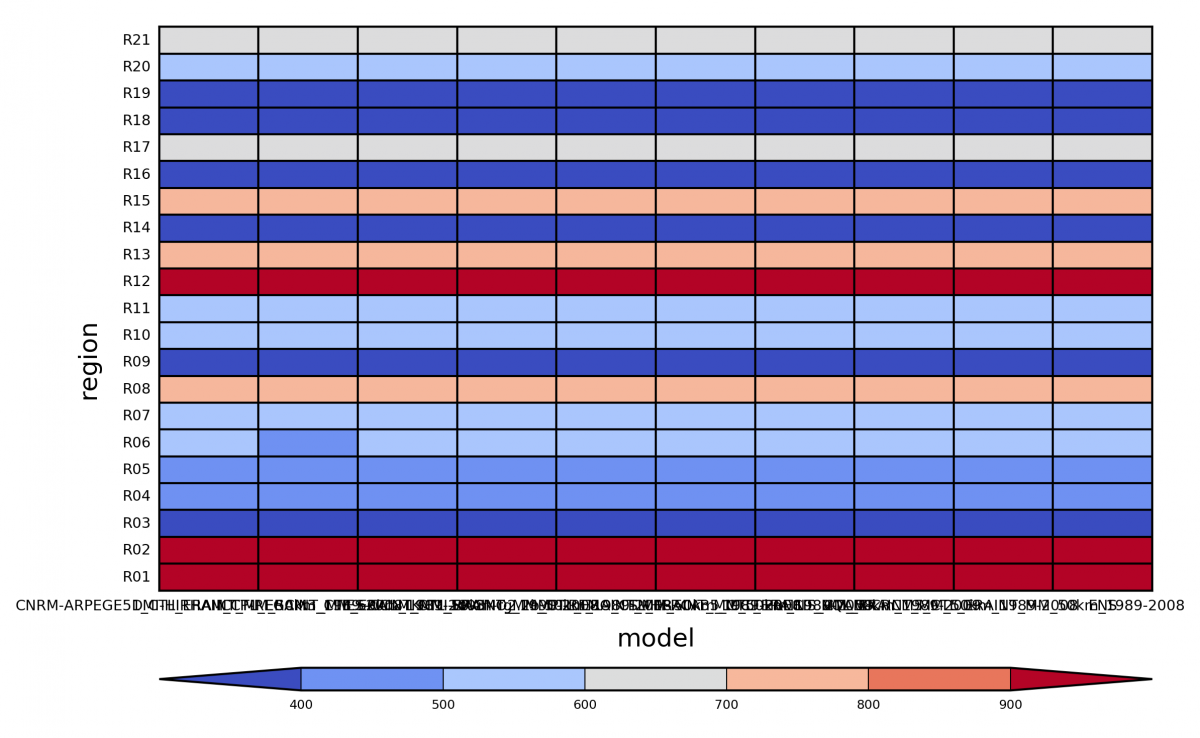
| (Fig. 8ad) The bias, standard deviation, correlation coefficient, and RMSE between the simulated and CRU temperature annual cycle for the mean temperature. | ||
Mean Maximum Temperature Configuration Files
Fig7e_8be Config Files
Edit Fig7e_8be.yaml files to change the working directory. Make sure you are in the RCMES folder and run the following:
python run_RCMES.py configuration_files/CORDEX-Africa_examples/Fig7e_8be.yaml
The following results are found within your working directory.
 |
| (Fig. 7e) The evaluation of the standardized standard deviations and correlations of the simulated mean maximum temperature. |
| Bias | Standard Deviation | |
 |
 |
|
| Correlation Coefficient | RMSE | |
 |
 |
|
| (Fig. 8be) The bias, standard deviation, correlation coefficient, and RMSE between the simulated and CRU temperature annual cycle for the mean maximum temperature. | ||
Mean Minimum Temperature Configuration Files
Fig7f_8cf Config Files
Edit Fig7f_8cf.yaml files to change the working directory. Make sure you are in the RCMES folder and run the following:
python run_RCMES.py configuration_files/CORDEX-Africa_examples/Fig7f_8cf.yaml
The following results are found in your working directory.
 |
| (Fig. 7e) The evaluation of the standardized standard deviations and correlations of the simulated mean minimum temperature. |
| Bias | Standard Deviation | |
 |
 |
|
| Correlation Coefficient | RMSE | |
 |
 |
|
| (Fig. 8be) The bias, standard deviation, correlation coefficient, and RMSE between the simulated and CRU temperature annual cycle for the mean minimum temperature. | ||
Cloud Fraction
Fig4f_9bcd Config Files
Edit Fig4f_9bcd.yaml files to change the working directory. Make sure you are in the RCMES folder and run the following:
python run_RCMES.py configuration_files/CORDEX-Africa_examples/Fig4f_9bcd.yaml
The following results are found in your working directory.
 |
| (Fig. 4f) The biases in the simulated annual cloud fraction against the CRU data for the individual models. |
 |
| (Fig. 9b) The evaluation of the standardized standard deviations and correlations of the simulated cloud fraction. |
| Bias | Standard Deviation | |
 |
 |
|
| Correlation Coefficient | RMSE | |
 |
 |
|
| (Fig. 9cd) The bias, standard deviation, correlation coefficient, and RMSE between the model-simulated and CRU cloud fraction annual cycle. | ||
Helpful Tips
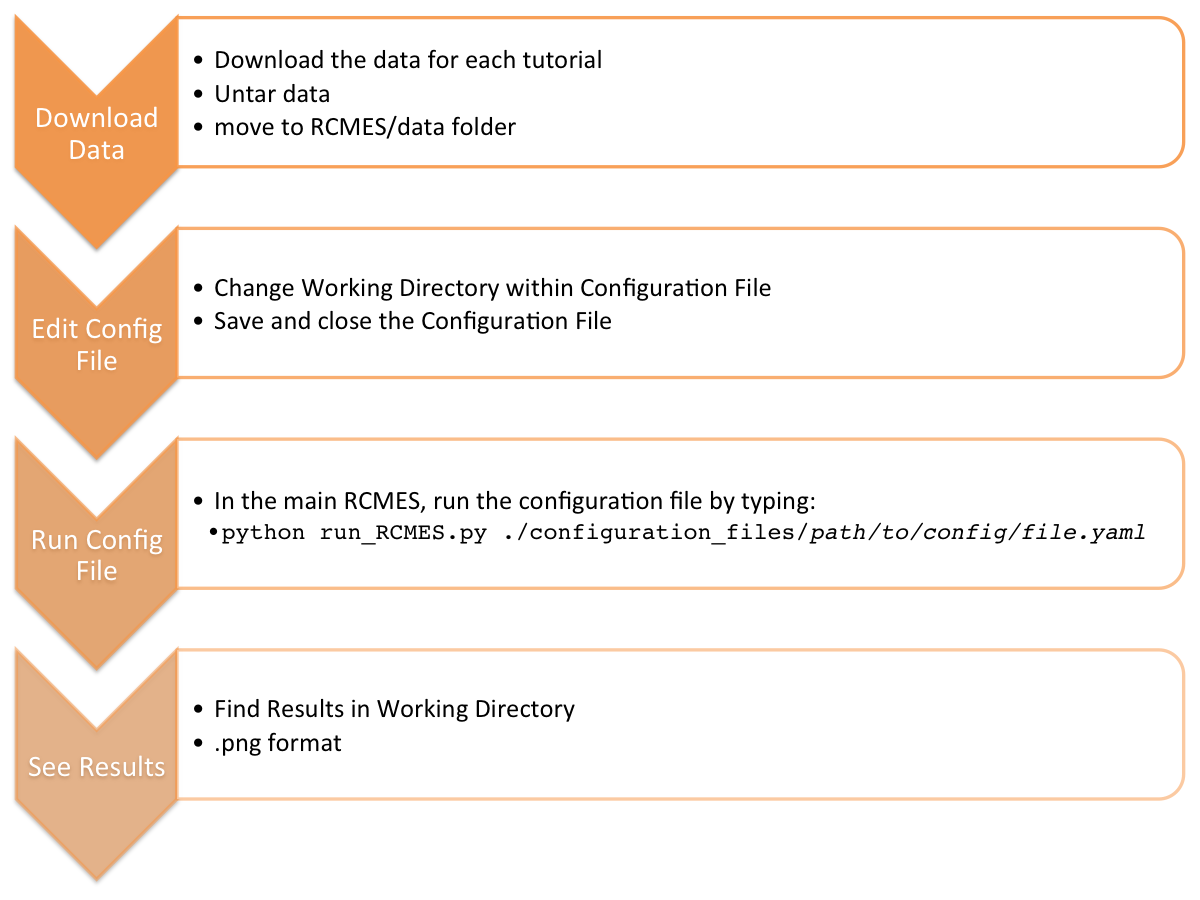
- Configuration File Workflow