
Quick Navigation
Getting Started
Main Menu
Manage Model
Manage Observation
Run
Helpful Tips
This tutorial will provide a step-by-step guide for performing a simple model evaluation with the RCMES CLI.
Here we will use precipitation output from the North American Regional Climate Changes Assessment Program (NARCCAP) RCMs as an example.
Download
If you have not already done so, please go to the RCMES Download Page and install RCMES using either the VM or conda to follow along with this tutorial.
All of the images in this tutorial are clickable and will open in a new tab for a zoomed view.
If you are using the VM for this tutorial, the data file is already located within your data folder in RCMES.
If you are using the Easy OCW to complete this tutorial, you will need to download the file and save to the data folder of RCMES. Go to climate/RCMES/data. Save the downloaded pr_WRFG_monthly_1980-2003.nc file in this folder. You are now ready to continue on to the Getting Started section of this tutorial.
Getting Started
IMPORTANT NOTE: To prevent the CLI App from crashing, please FULLY EXPAND your terminal window now for this tutorial.
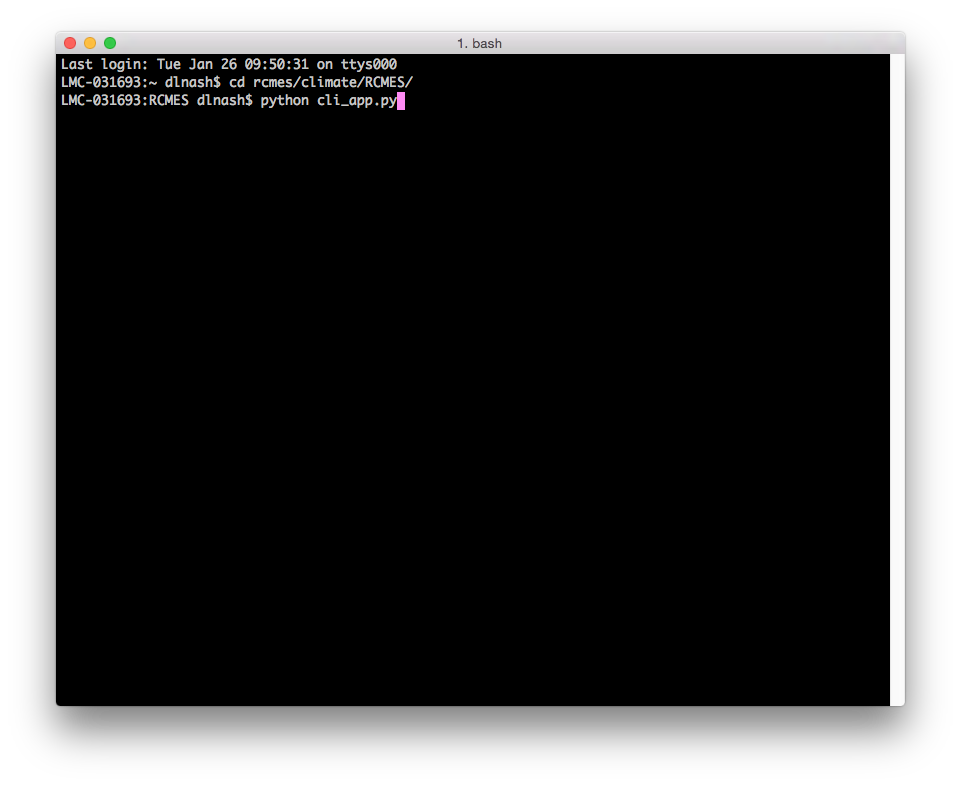
In the Terminal application, navigate to the folder containing the RCMES CLI
cd ~/RCMES
Then execute the program by inputting
python cli_app.py
The successful installation and execution of the RCMES CLI will reveal the Main Menu. A maximized window is recommended to facilitate workflow.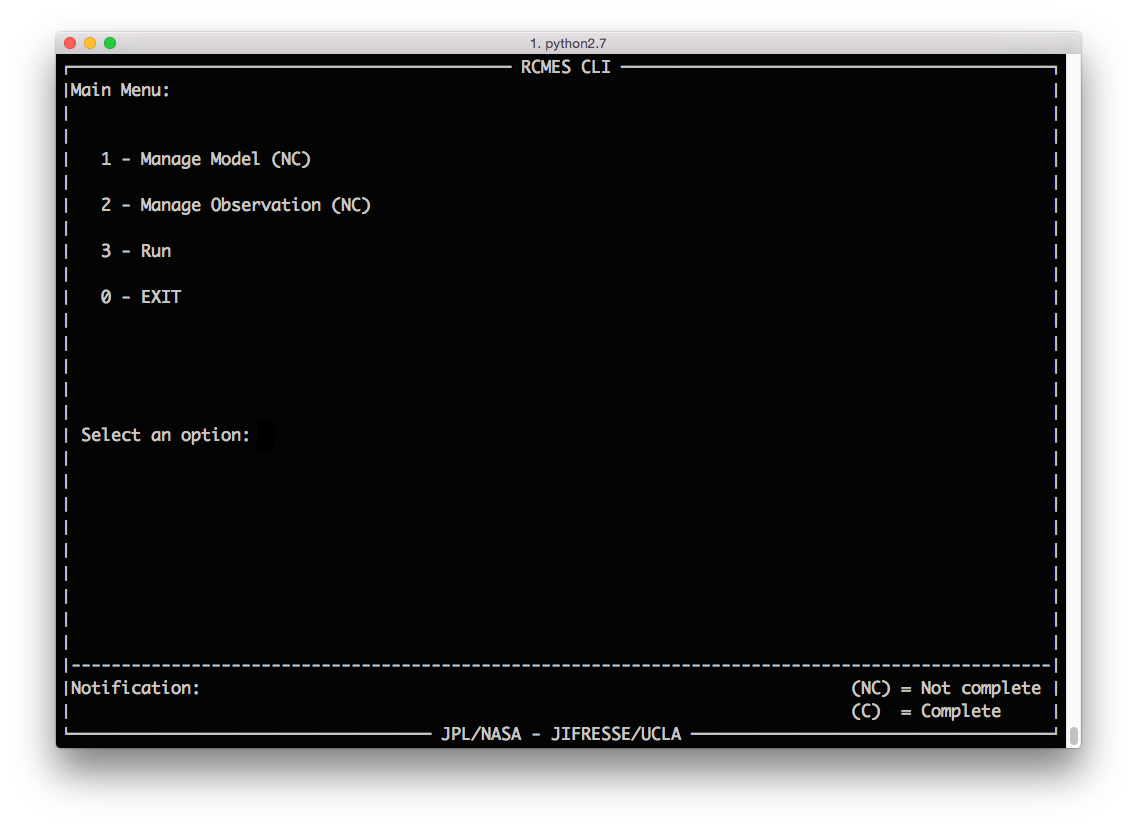
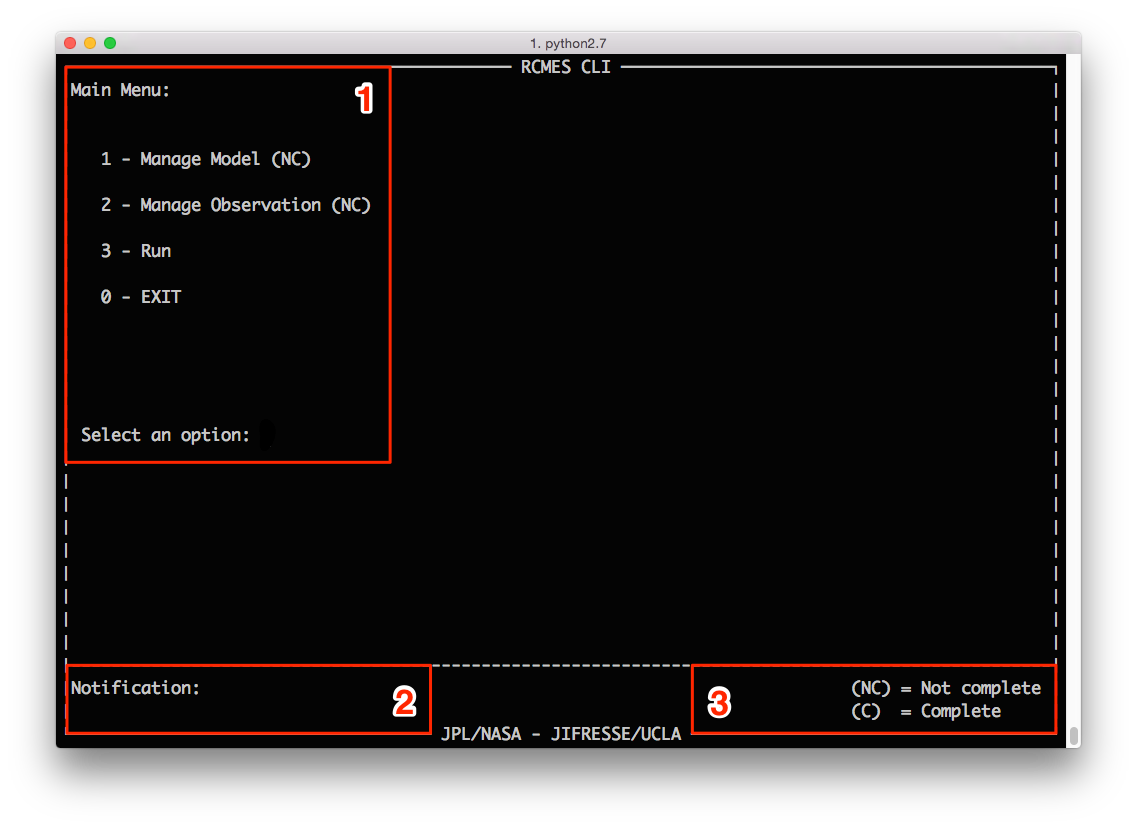
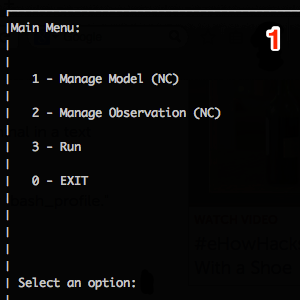
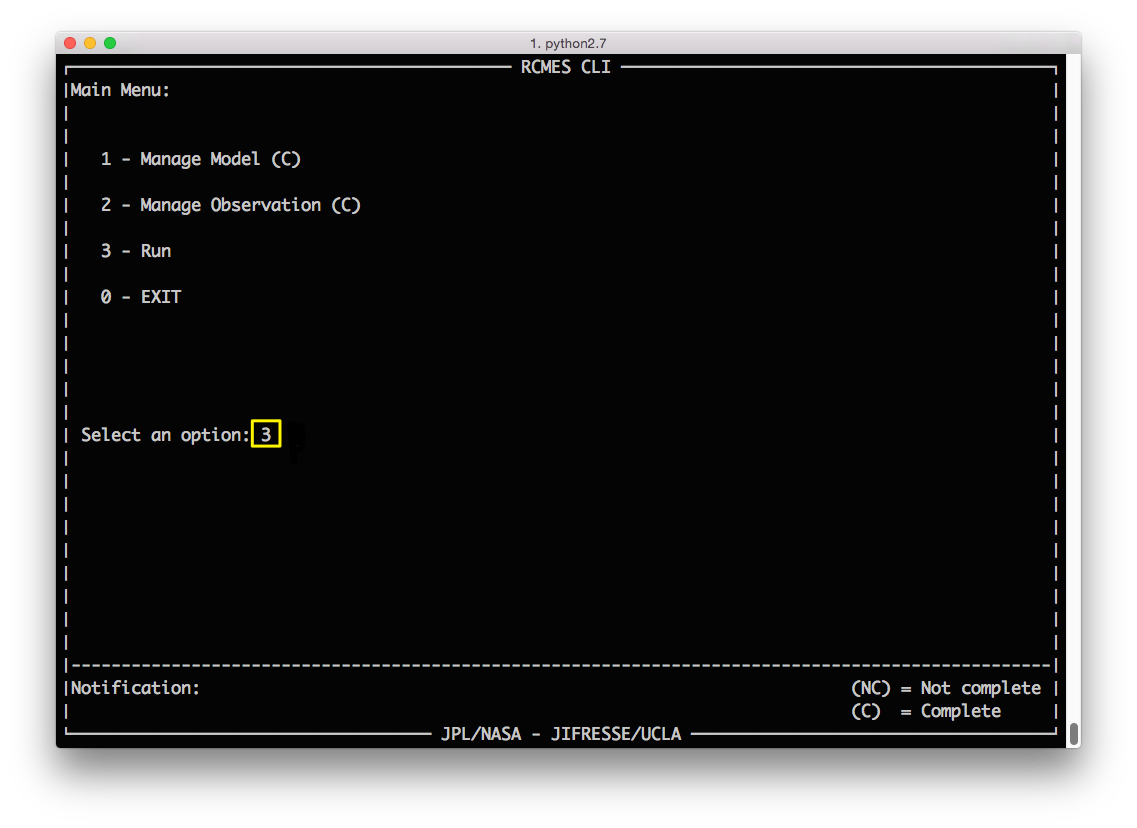
Main Menu
 |
 |
 |
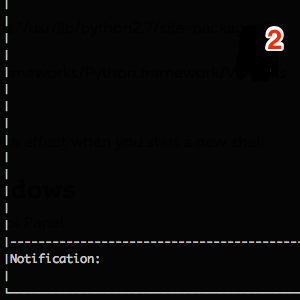
| Top left of the Main Menu is where the user can interface with the RCMES. |
Bottom left of the Main Menu is the Notification Bar which notes the progress of the analysis. |
Bottom right of the Main Menu contains the legend. |
Main Menu: Manage Model (Option 1)

From the Main Menu,
SELECT Option 1 - Manage Model and PRESS ENTER.
For this tutorial, a local model file will be loaded from the downloaded files during the setup process. 
SELECT Option 1 - Load Local Model File and PRESS ENTER.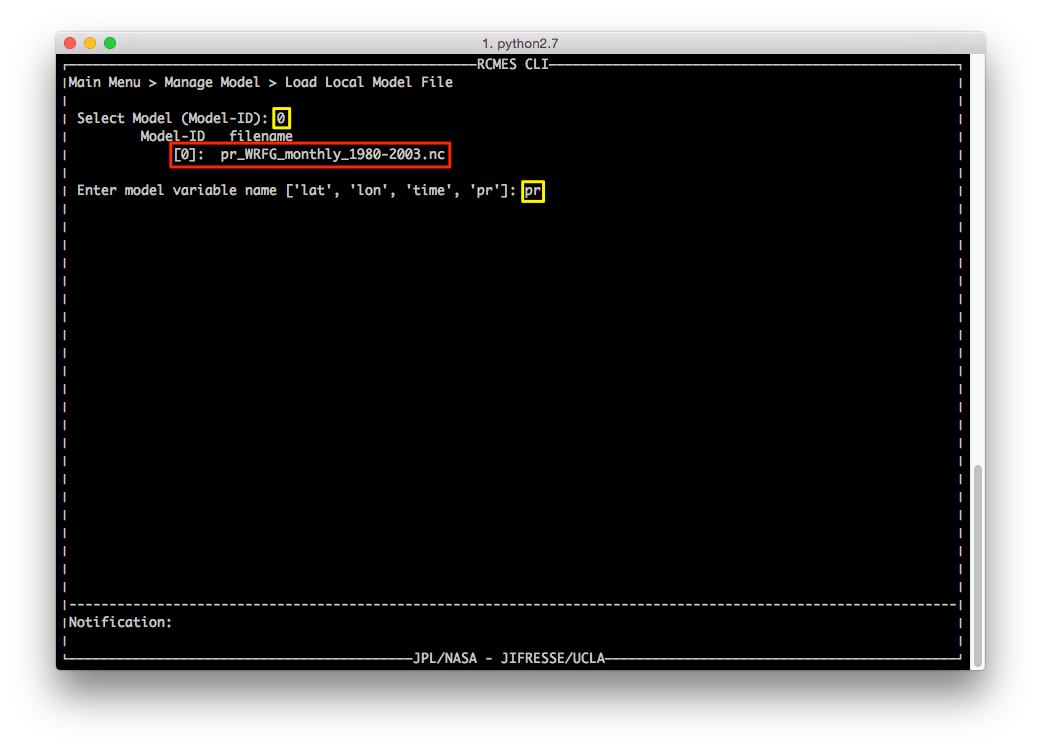
When prompted to select the model, TYPE 0 to select pr_WRFG_monthly_1980-2003.nc and PRESS ENTER.
When prompted to enter variable name,
TYPE "pr" because the file loaded in the previous step contains precipitation data and PRESS ENTER.
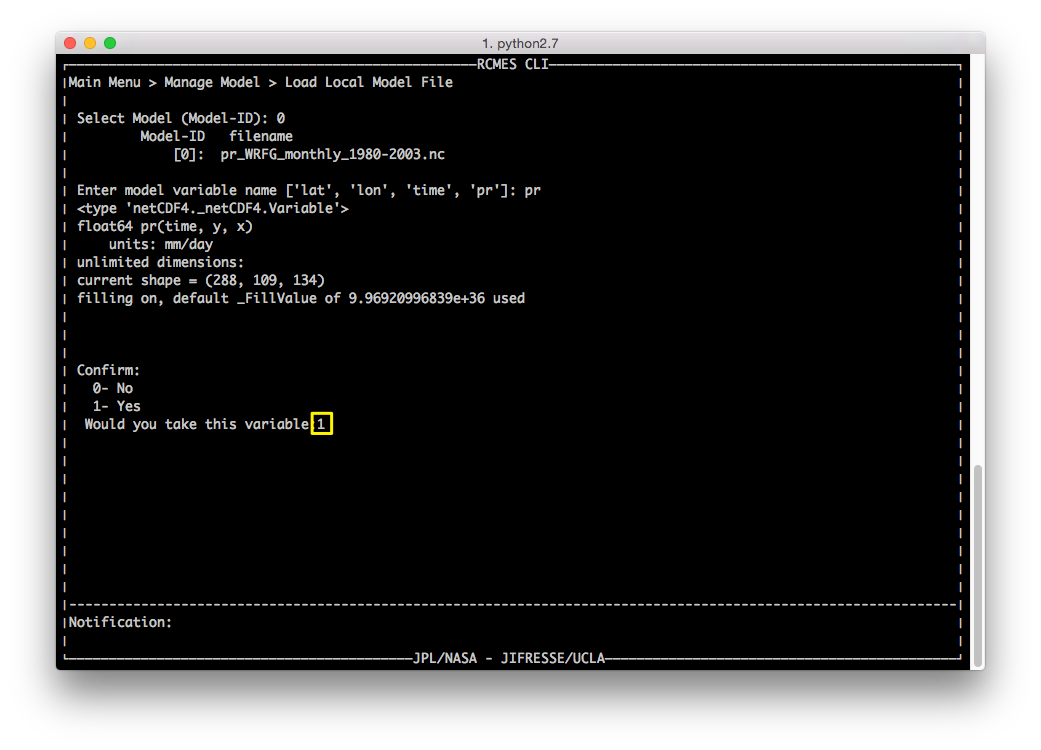
The program will ask to confirm the data loaded. Confirm by ENTERING 1 and PRESS ENTER.
The Notification Bar will show that the file was successfully loaded and the program will return to the Manage Model Menu.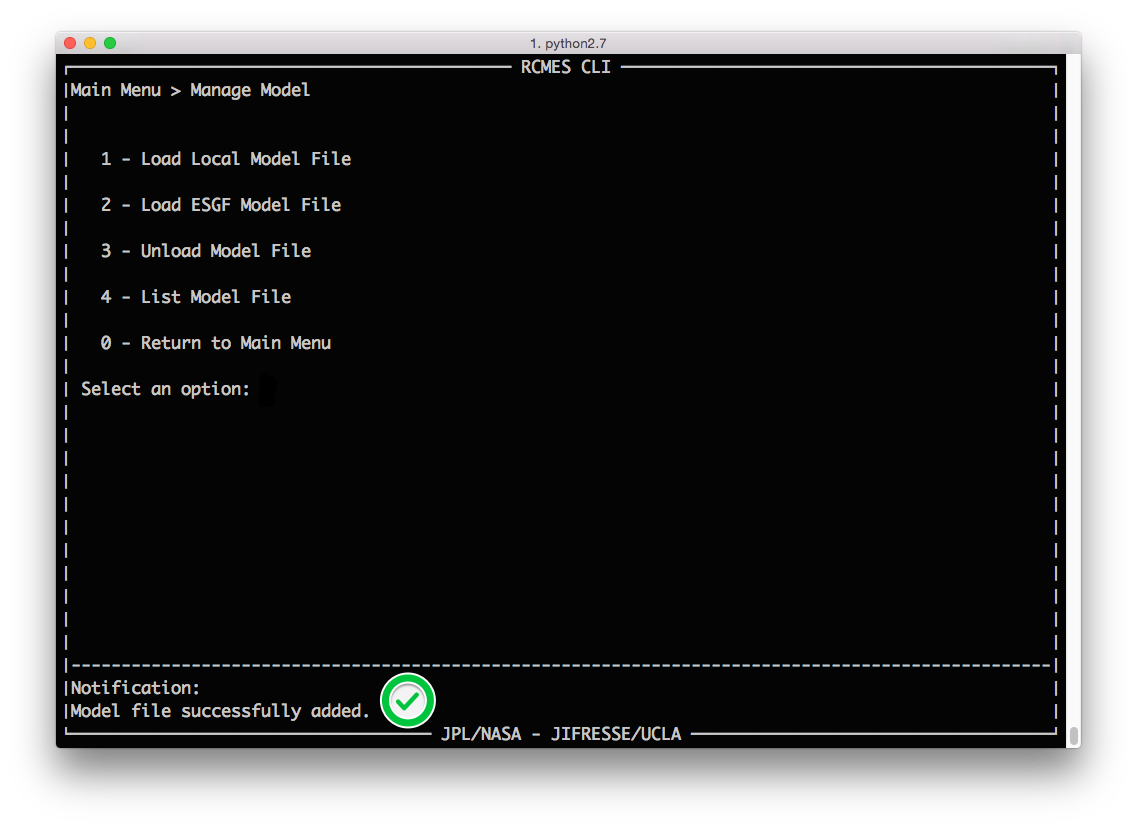
If you receive an error, double check the model path name and the corresponding variable name. 
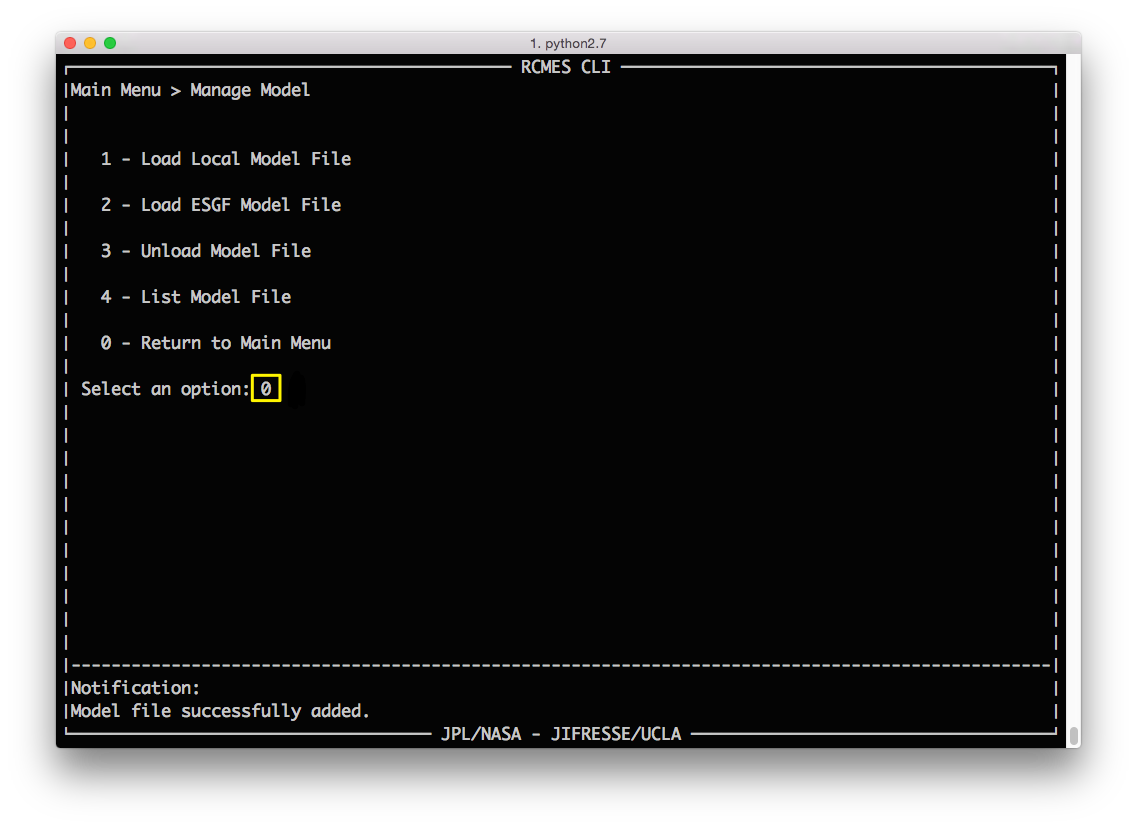
Once the model file is successfully loaded,
Enter Option 0 to return to the Main Menu.
On the Main Menu, Option 1 should now be noted as complete (C).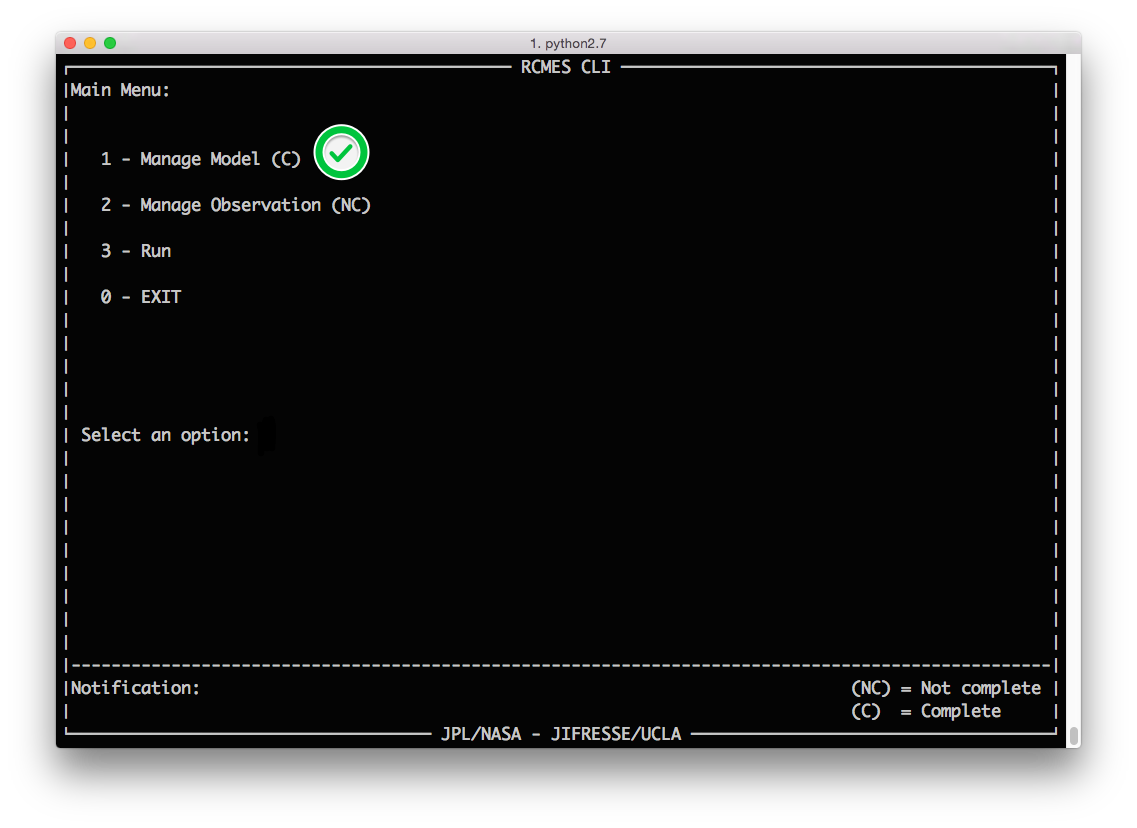
Main Menu: Manage Observation (Option 2)

From the Main Menu,
SELECT Option 2 - Manage Observation and PRESS ENTER.
For the purposes of this tutorial, an observation file will be loaded from the RCMES Database.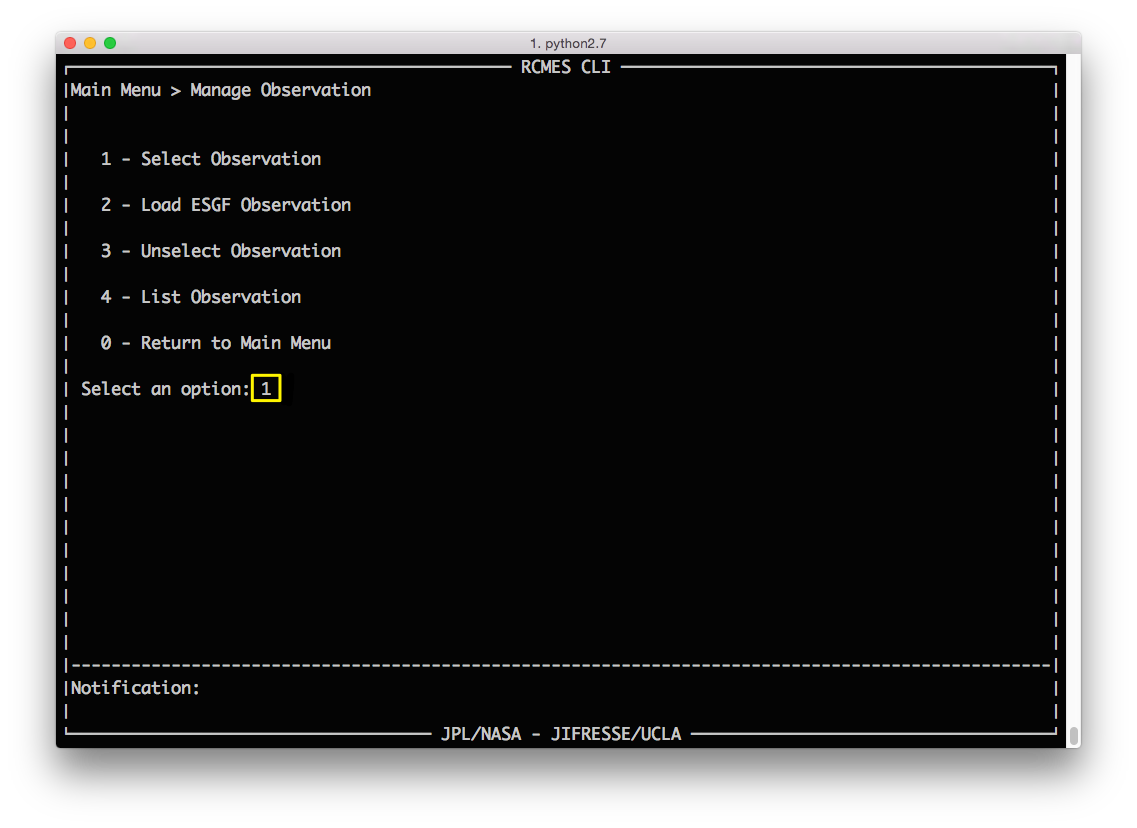
SELECT Option 1 - Select Observation and PRESS ENTER.
For this tutorial, NASA TRMM precipitation observation data will be used.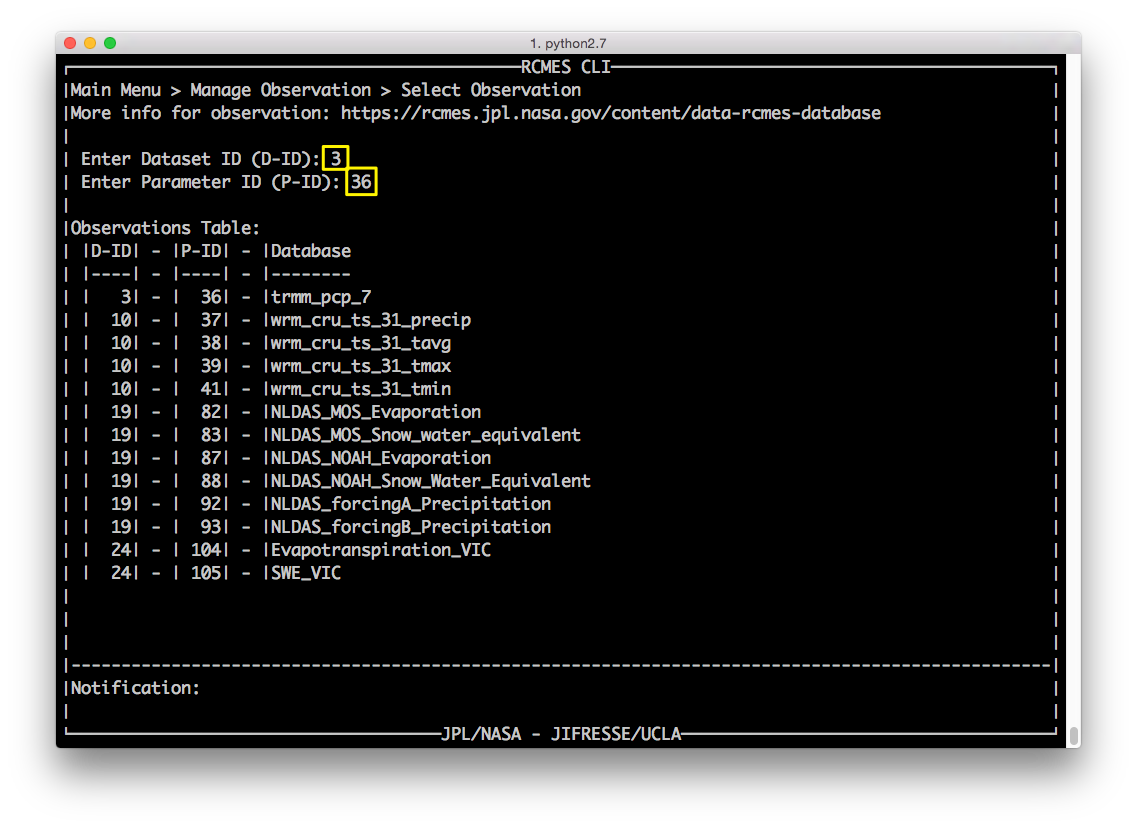
Enter Dataset ID (D-ID): 3
Enter Parameter ID (P-ID): 36
The Notification Bar will show that the observation was successfully selected and the program will return to the Observation Menu.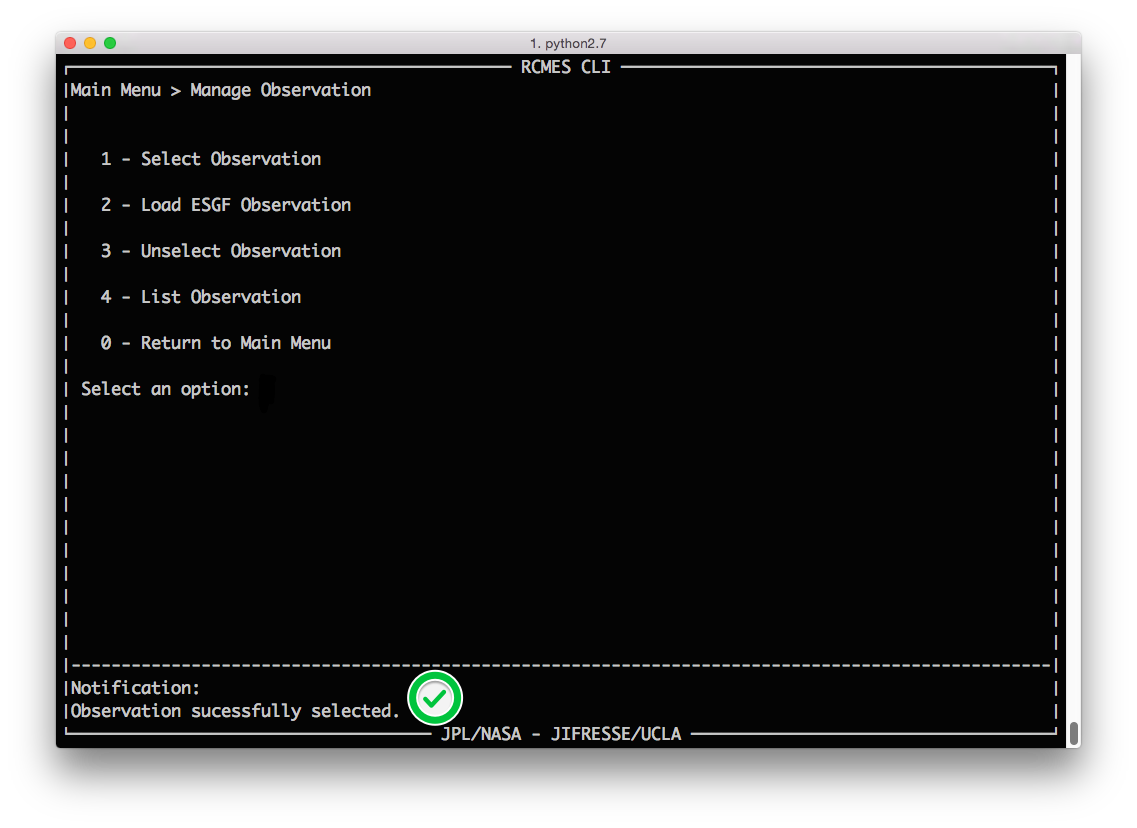
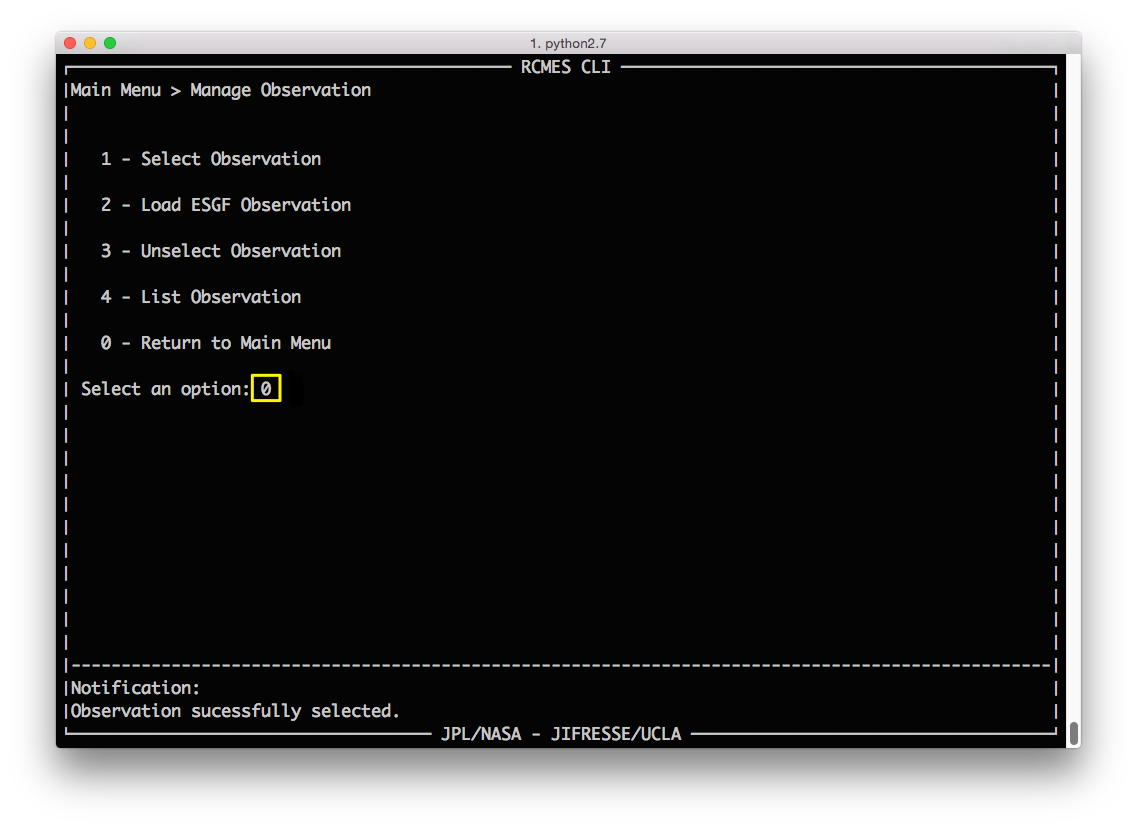
Once the observation is successfully selected, SELECT Option 0 to return to the Main Menu.
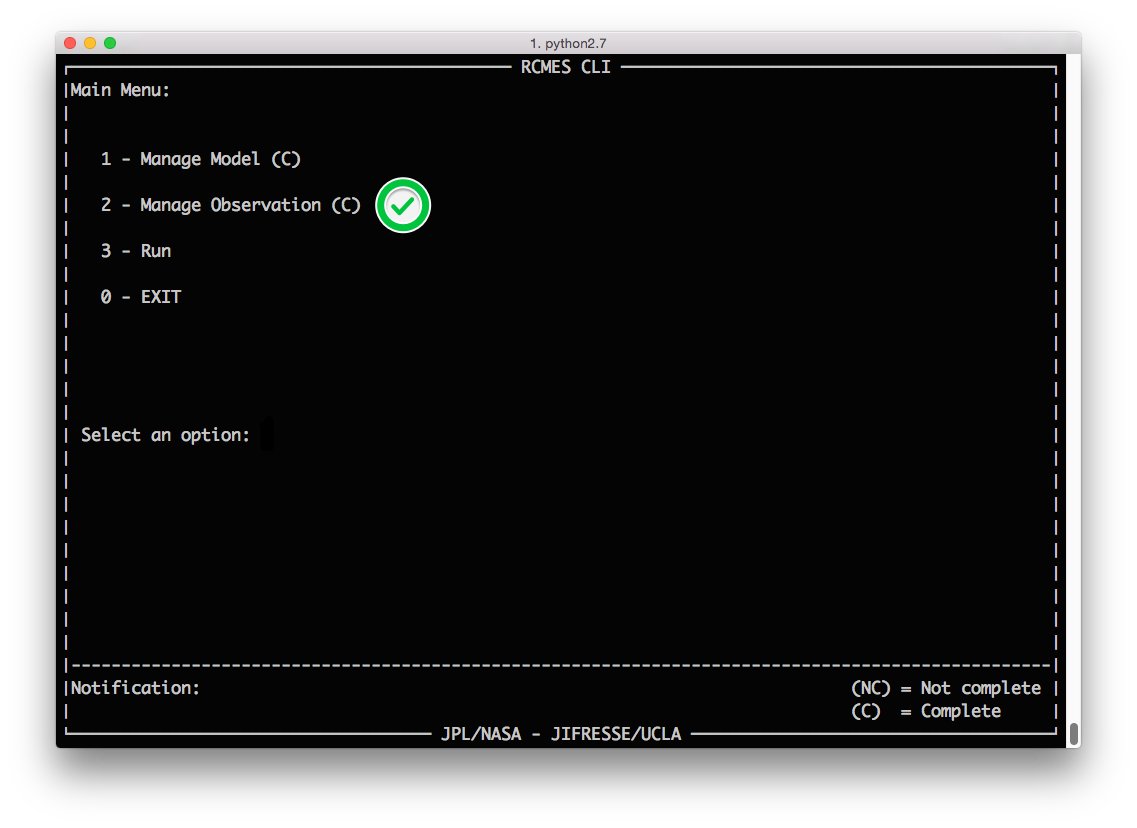
On the Main Menu, Option 2 should now be noted as completed (C).
Main Menu: Run (Option 3)
NOTE: The terminal window needs to be FULLY EXPANDED, otherwise an error may occur.
From the Main Menu,
SELECT Option 3 - Run and PRESS ENTER.
Important Note: The program will only run if both Options 1 & 2 are completed (C). Also, the terminal window needs to be FULLY EXPANDED before you select Option 3 - Run - otherwise an error will occur.
The left split screen shows the information of the model file, observation, and parameters of both where there is overlap.
The right split screen allows for the user to modify the parameters and run the analysis.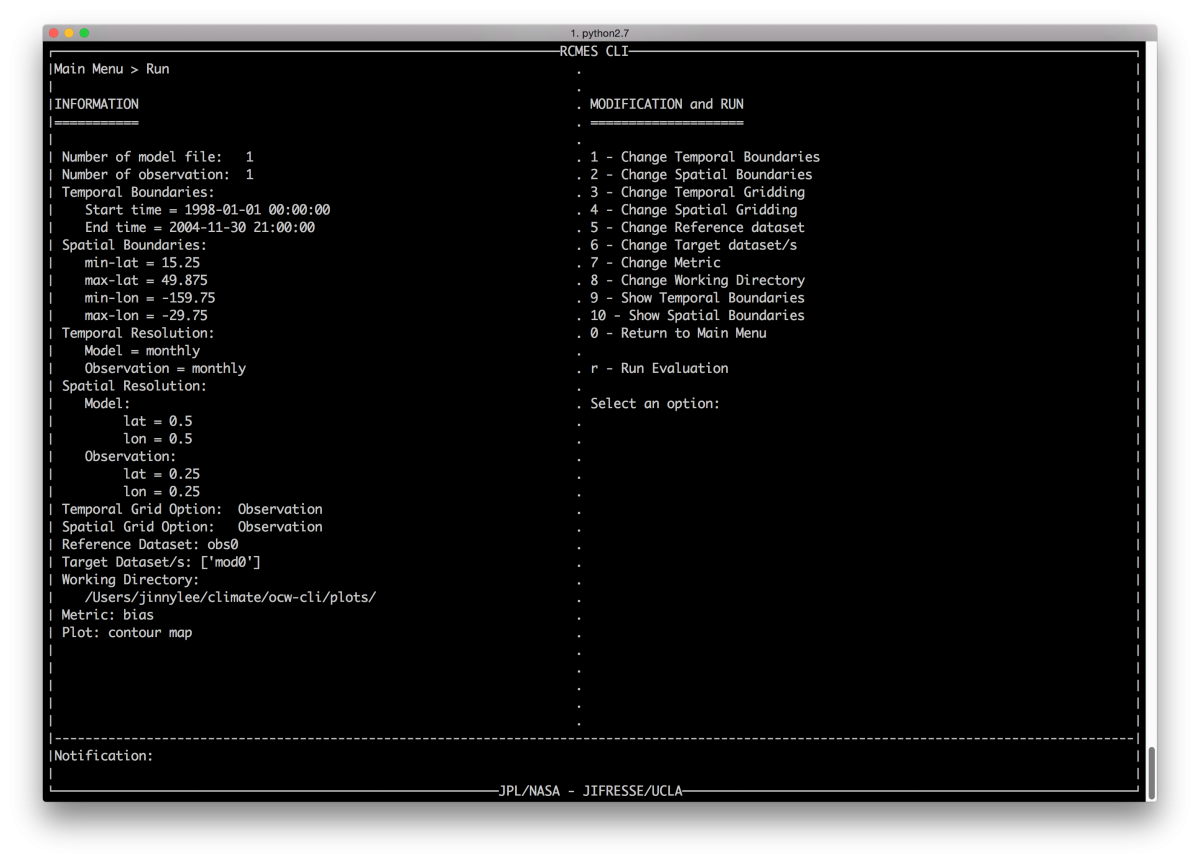
For this tutorial, change the temporal boundaries to January 1, 2000 through December 31, 2000.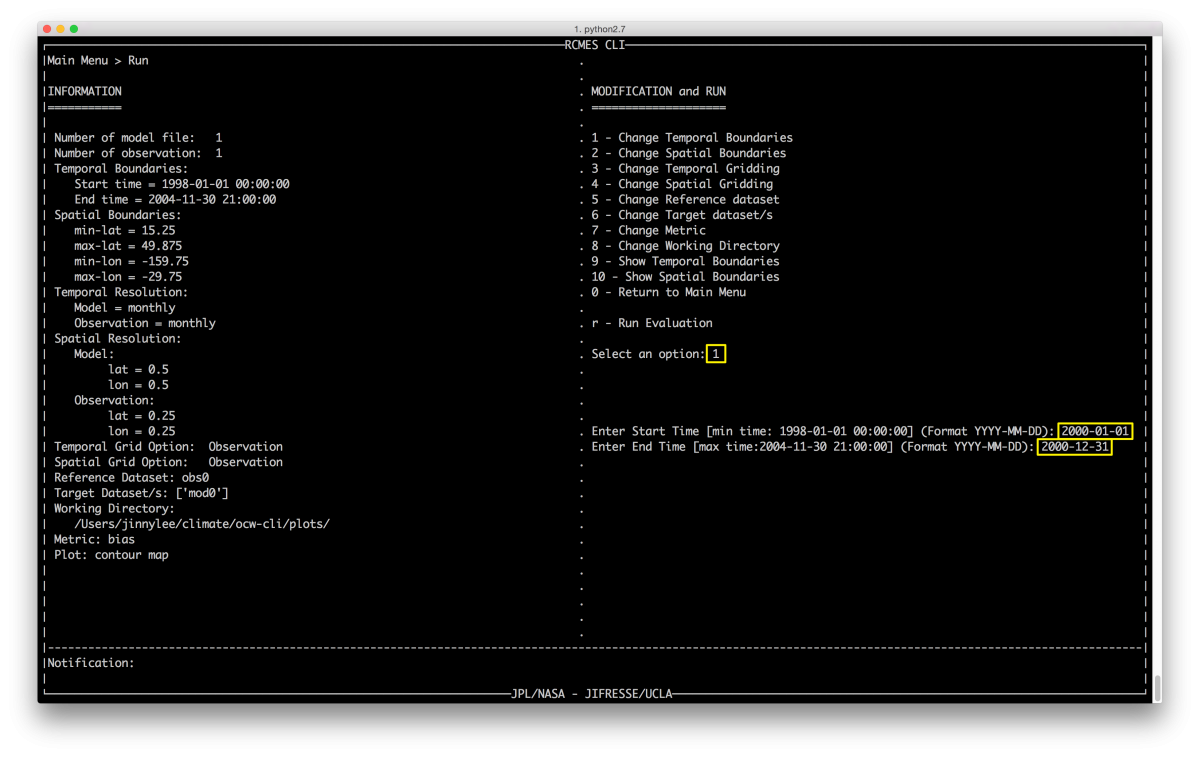
To do this,
SELECT Option 1 - Change Temporal Boundaries
Enter Start Time (Format YYYY-MM-DD): 2000-01-01
Enter End Time (Format YYYY-MM-DD): 2000-12-31
The Notification Bar will indicate that the temporal boundaries have been successfully changed.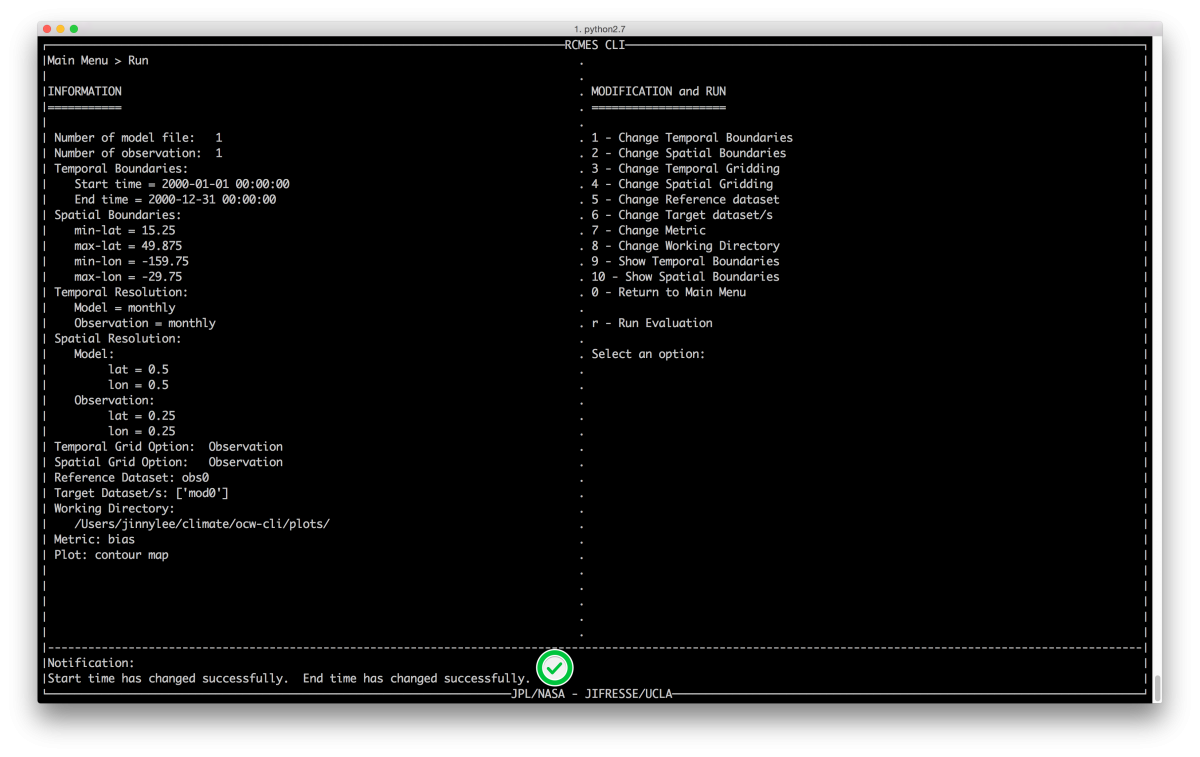
For this tutorial, change the spatial boundaries to show the contiguous United States only.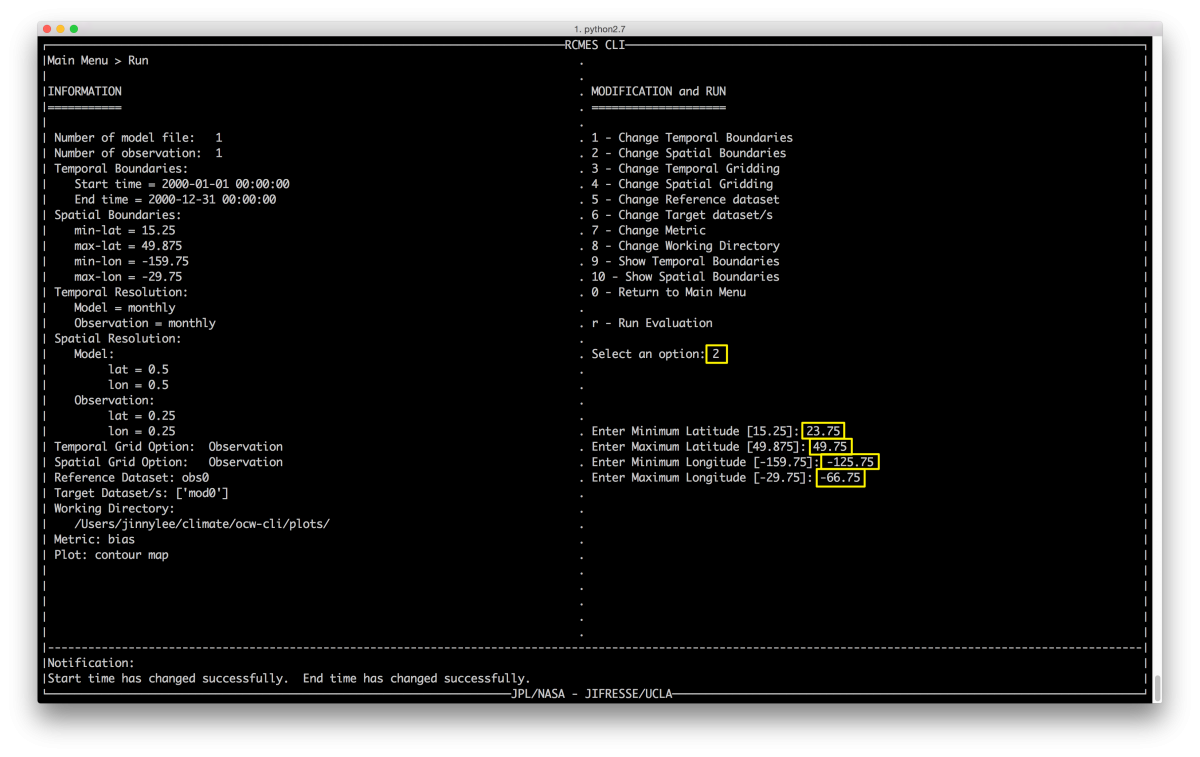
To do this, SELECT Option 2 - Change Spatial Boundaries
Enter Minimum Latitude: 23.75
Enter Maximum Latitude: 49.75
Enter Minimum Longitude: -125.75
Enter Maximum Longitude: -66.75
The Notification Bar will indicate that the spatial boundaries have been successfully changed.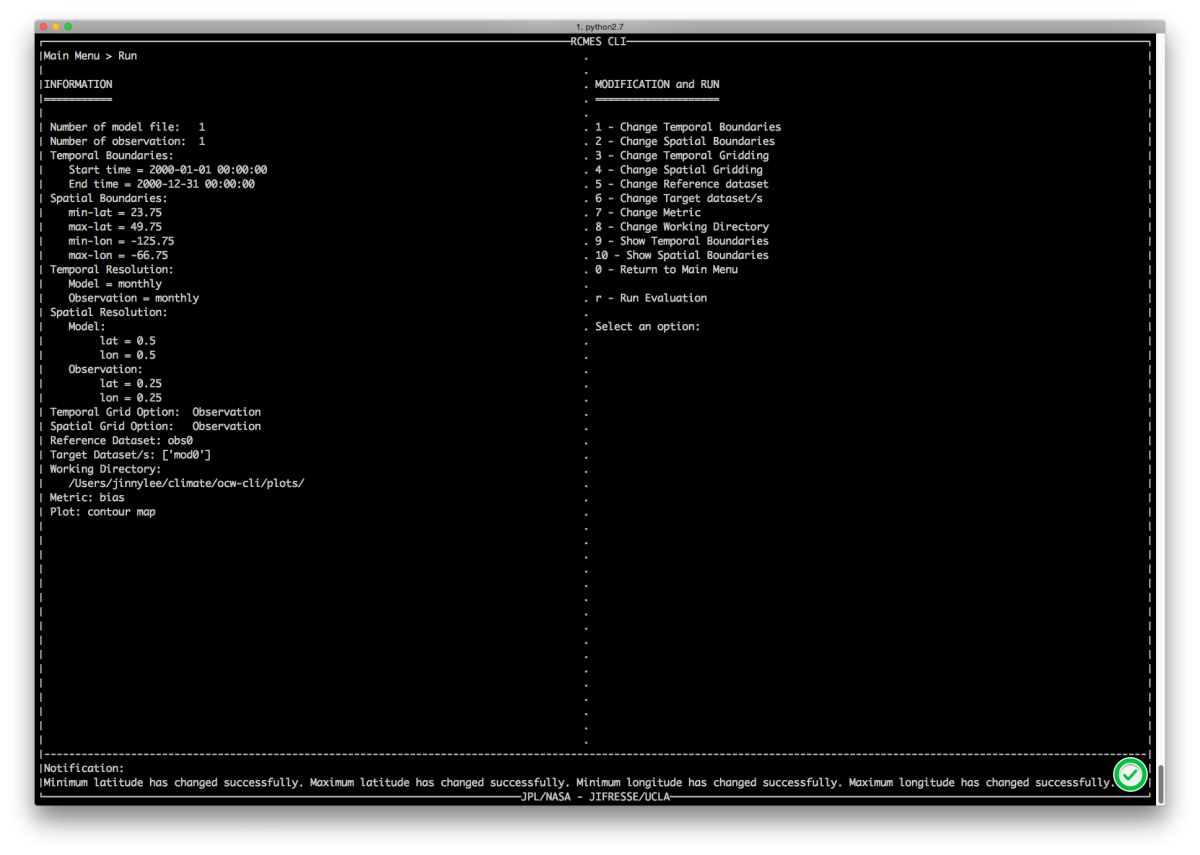
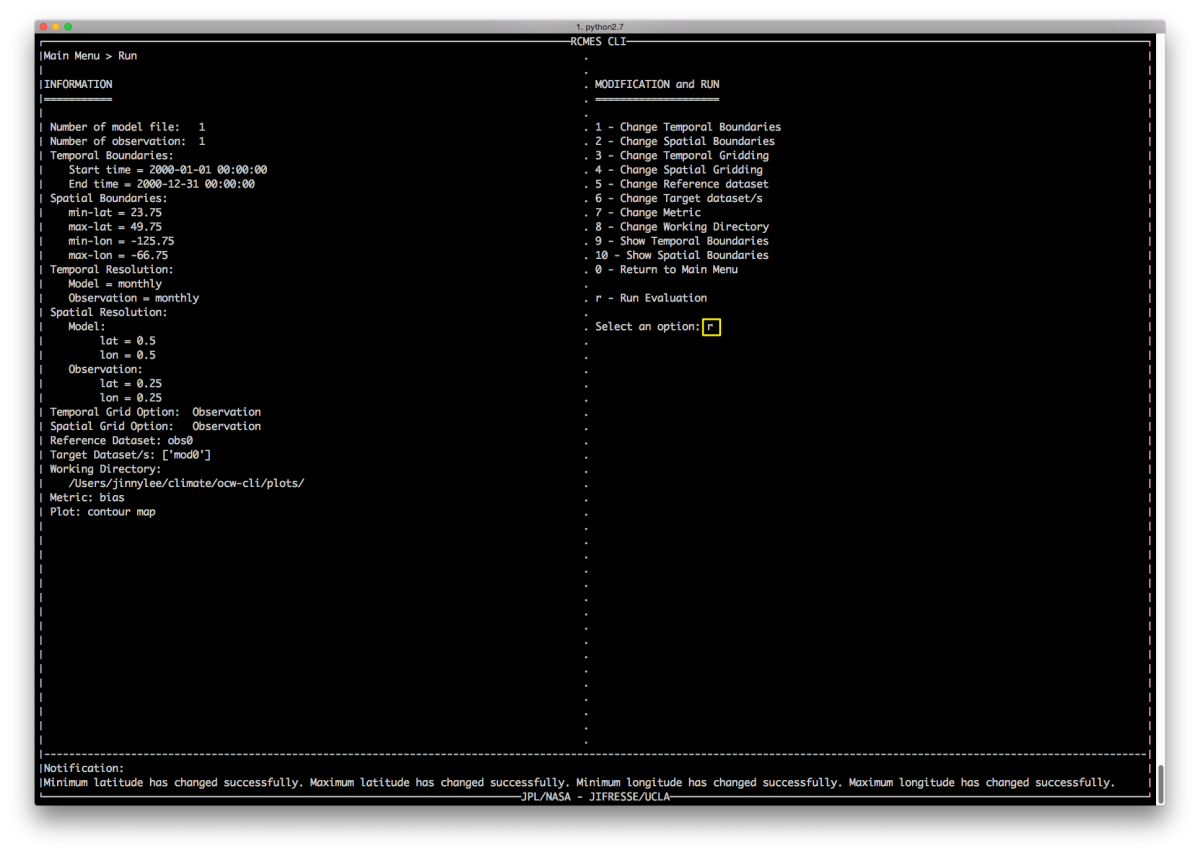
To the run the evaluation,
ENTER r - Run Evaluation and PRESS ENTER.
The progress of the evaluation will be noted on the main screen.
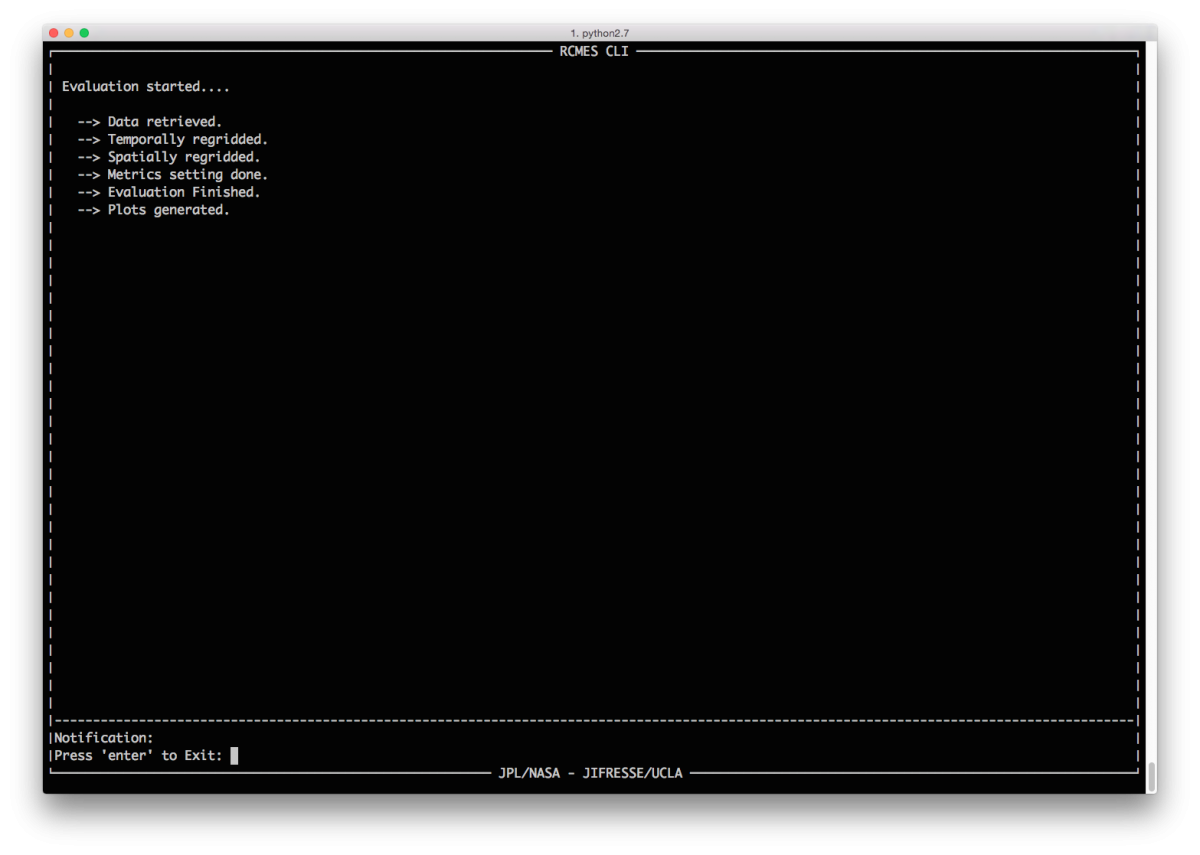
Once the evaluation is done,
PRESS ENTER to return to the Run Menu.
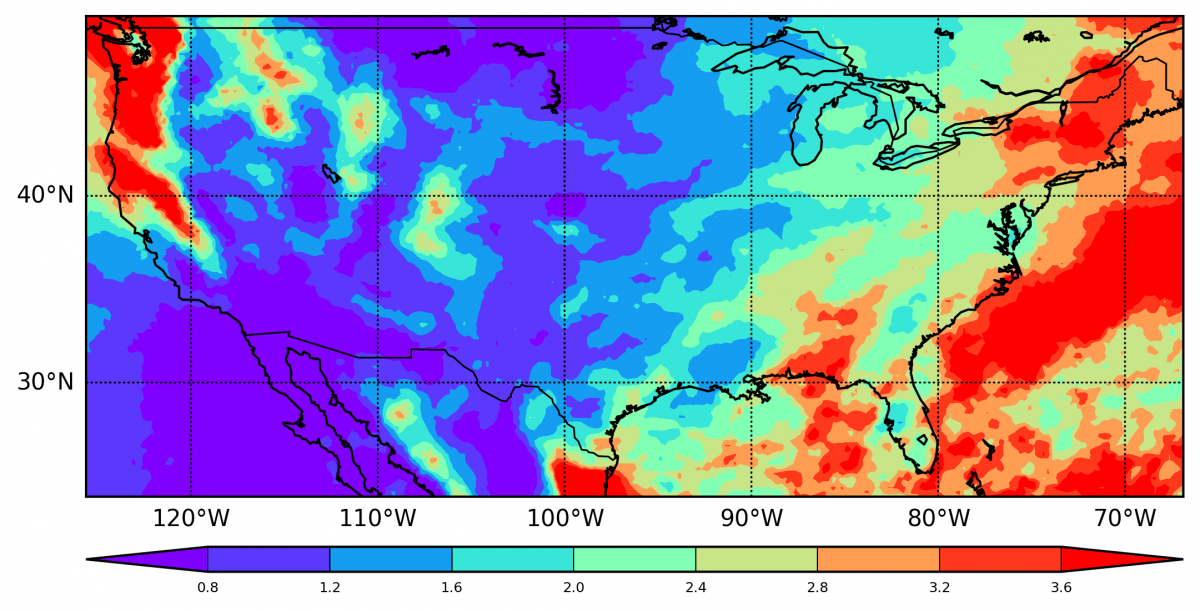
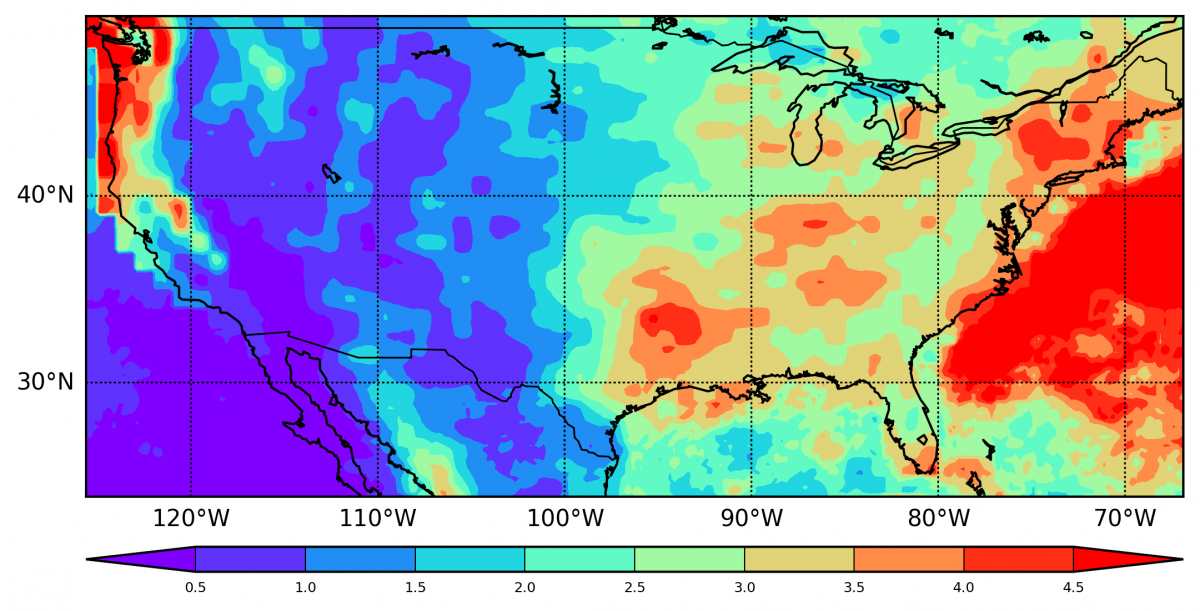
In the working directory (~/RCMES/plots), you will find the model, observation, and evaluation plots as .png image files.
| MODEL | OBSERVATION | EVALUATION |
 |
 |
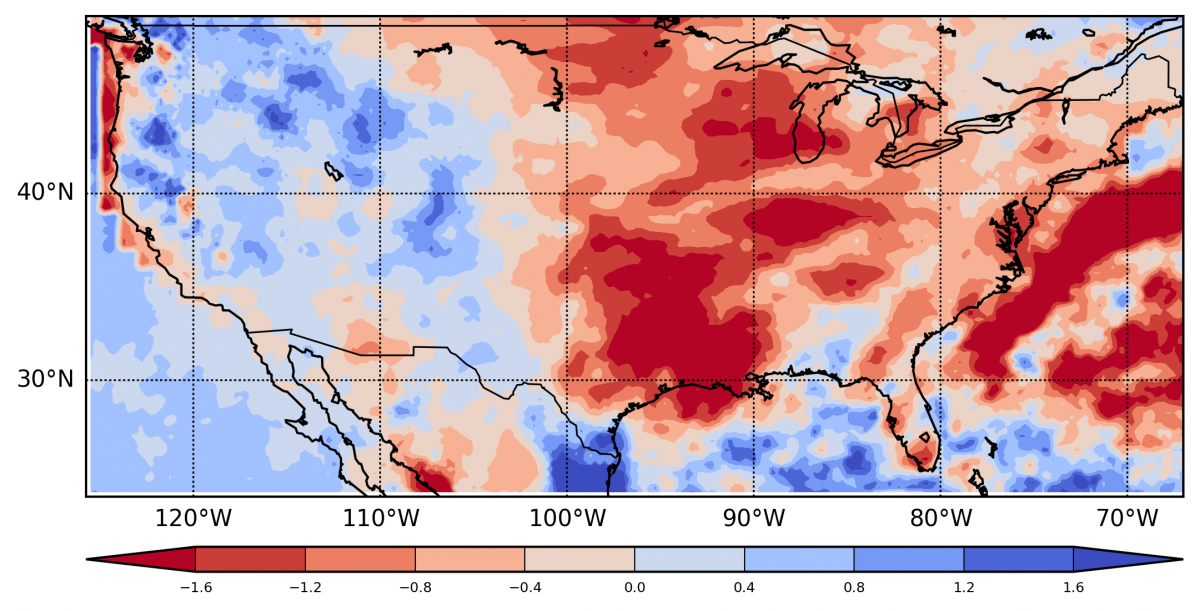 |
| pr_WRFG_monthly_1980-2003.nc | NASA TRMM | Bias Contour Plot |
Helpful Tips
-
RCMES CLI should be viewed with a maximized window to help workflow.
-
Selecting Option 3 - Run without fully expanding the terminal window may cause errors.
-
Models and observations can be loaded in any order.
-
Both Models (Option 1) and Observation (Option 2) must be loaded (completed) in order to access the Run Menu (Option 3).
-
Long temporal and large spatial boundaries will require more time for the evaluation to be performed.