
Quick Navigation
Download
Exploring the Example
Running the Example
Winter Precipitation Characteristics in Western United States Related to Atmospheric River Landfalls: Observations and Model Evaluations
J. Kim, B. Guan, Duane E. Waliser, R. D. Ferraro, J. Case, T. Iguchi, E. Kemp, W. Putman, W. Wang, D. Wu, and B. Tian
Climate Dynamics
2017, pp 1 - 18
DOI: 10.1007/s00382-017-3601-5


Examining Atmospheric River (AR) landfalls on the winter precipitation over Western United States using RCMES
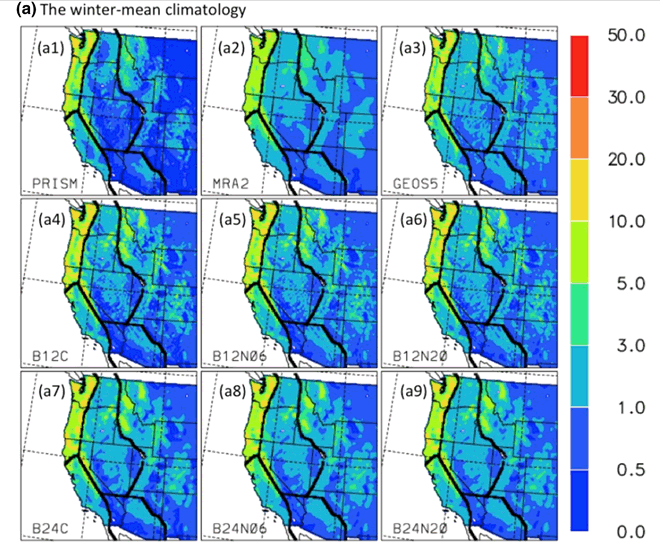
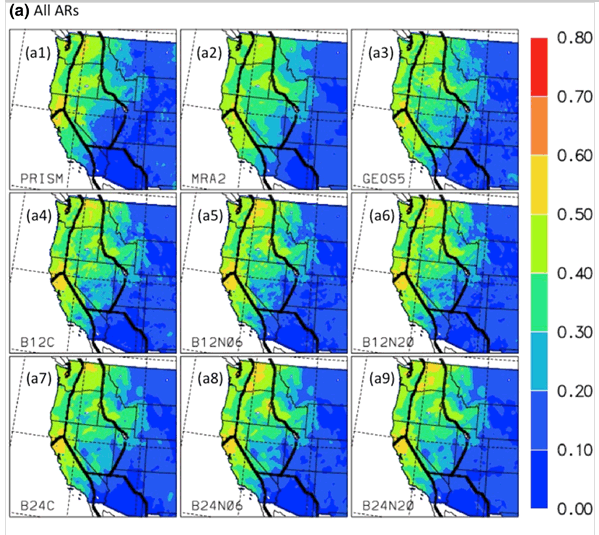
In this example, simulations of winter precipitation in the Western United States (WUS) region are examined during all atmospheric-river landfalls using RCMES. This example uses daily precipitation data from NASA-NLDAS for observation data. Model data for this example includes GEOS5, MERRA2, and NU-WRF - model data generated in the NASA downscaling experiment (NASA Technical Report; Ferraro et al., 2017). This example utilizes an iPython Notebook to add a dataset processor to the RCMES code in order to calculate the precipitation that occurs during AR Landfalls.
Download
Download and Install RCMES
If you have not already done so, please review Getting Started with RCMES and Download RCMES using either VM or Easy OCW.
Download Data for Tutorial
CLICK HERE to download the data for this tutorial.
Save your data to an appropriate place. It is recommended that you save the dynamical_downscaling_2 folder within your RCMES folder.
Exploring the Example
AR-Landfall Chronology
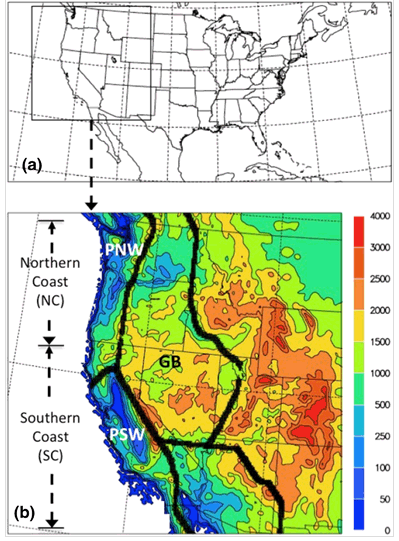
In the ar_landfall folder within the dynamical_downscaling_2 folder in the RCMES main folder, a text file containing the AR-landfall chronology for the entire west coast (including the California coast and the Pacific Northwest Coast) can be found. This file is needed to create an index of dates when an AR Landfall occurred. The index is then used to create a dataset with only the dates of the AR Landfalls.
Model and Observation Data
The models and observations can be found in the dscale_2_data folder within the dynamical_downscaling_2 folder. This includes precipitation data from the NASA-NLDAS as well as models generated from the NASA dynamical downscaling experiment.
iPython Notebook
Project Jupyter was used for this example to break down the process of RCMES. This allows the user to move through the process of RCMES as well as add their own code to run the evaluation. This particular example creates a time index using the .txt file that contains a list of AR Landfall Dates for the US West Coast. The time index is then used to subset the observation and model datasets.
This analysis covers the period between November 1, 1999 and March 31, 2010. The analysis uses daily data from November to March from each of those 4 years. The spatial range covers the western United States. The reference data, NLDAS, is sourced locally and uses the variable "pr" for precipitation.
The user should open the RCMES AR Downscaling iPython notebook file (RCMES_AR_Downscaling.ipynb) using Jupyter Notebook.
Running the Example
In Terminal, launch Jupyter Notebook. (Note: Jupyter must be installed by the user)
jupyter notebook
Jupyter Notebook will launch. Navigate to the dynamical_downscaling_2 folder. (/RCMES/dynamical_downscaling_2) and open the RCMES AR Downscaling Part II iPython Notebook.
To run the example, click Cell - Run All. The evaluation will take a few minutes to run. When it is finished the result can be seen at the bottom of the iPython notebook. The result can also be found in the dynamical_downscaling_2 folder.
 |
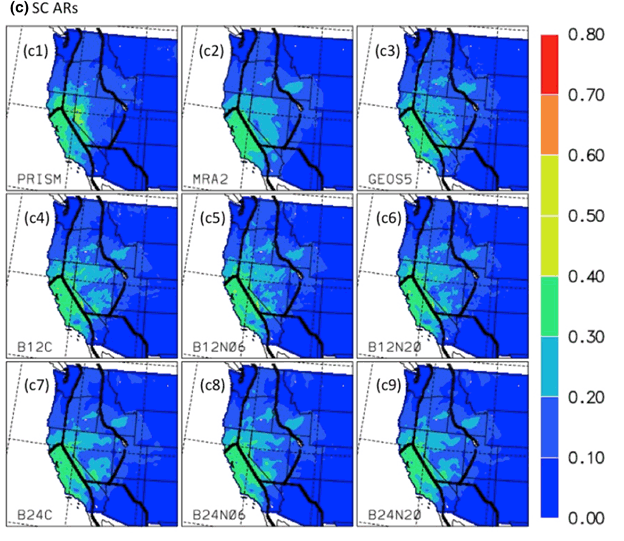
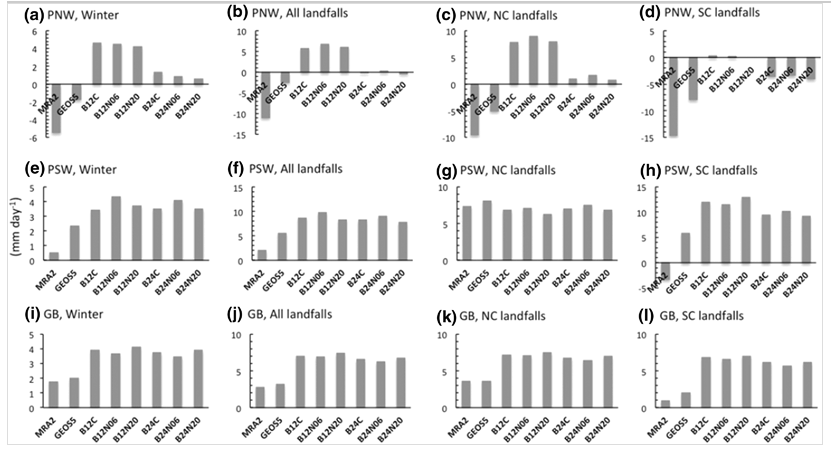
| (Fig. 1) The daily-mean precipitation (mm/day) bias against NLDAS from November to March over the western United States. |