Quick Navigation
Download
Example 1
Example 2
Example 3
Example 4
During an 18 month period in 2014-15, several NASA centers (AMES, GSFC, JPL, MSFC), conducted a project to assess the credibility of dynamically-downscaled climate projections using the NASA Unified-WRF (NU-WRF), a version of WRF that integrates unique physics modules and capabilities developed at NASA, and the NASA GEOS-5 AGCM replay simulations. The purpose of this project is to understand how much fidelity one should expect from dynamical downscaling a GCM, and to test the effects of grid resolution and spectral nudging on model performance. The project used NASA's MERRA-2 reanalyses from 1999-2010 as boundary conditions to NU-WRF for a series of experiments covering the CONUS. The MERRA-2 reanalyses were also used as the observational nudging reference for the GEOS-5 replay simulations and for NU-WRF simulations that utilized nudging. See the table below for the various simulations performed and analyzed in this experiment. Results are then compared to observational datasets, in some cases from satellites, gridded in-situ products and reanalyses (NASA Technical Report; Ferraro et al., 2017).
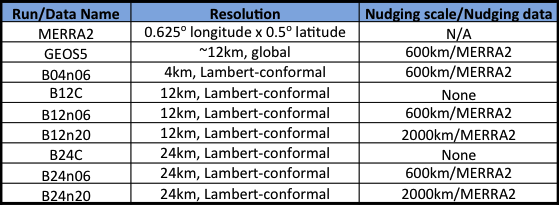
The project focused on evaluating results using metrics developed for three high-impact phenomena affecting the continental US, targeting mainly precipitation and surface temperature: 1) west coast atmospheric rivers during winter, 2) mesoscale convective systems and the diurnal cycle over the Great Plains during summer, and 3) severe winter storms over the Northeast. Additional evaluation metrics included continental patterns of precipitation, temperature, etc, spectral characteristics of the simulated upper-level winds, and PDFs of precipitation intensity and duration. NU-WRF experiments were run at 24-, 12-, and 4-km horizontal grid spacing using NASA supercomputing resources (e.g. NAS, NCCS). In order to investigate the effects of the spectral nudging scale on simulating the selected phenomena, the 12- and 24-km resolution NU-WRF simulations were run with three different nudging scales; no nudging, 600km, and 2000km, applied to temperature and winds. The GEOS-5 replay simulation applies a nudging methodology with a nudging scale of about 600km, that is applied to temperature, winds and moisture. GEOS-5 was not included in the analysis for this tutorial. The table above summarizes the model experiments performed. The simulations were analyzed for AR-related climatology for the 10 winters (November through March) of 2000-2009, except for B4 which were analyzed for the winters of 2000-2004. Results from this project are in the process of final analyses and publications are in preparation.
The purpose of this Configuration File is to illustrate the use of RCMES to perform very basic comparisons between the NU-WRF regional model outputs and observation data, in this case from NASA's TRMM precipitation satellite mission and NASA's Land Data Assimilation System (NLDAS-2). Additional examples of RCMES use for this project's data in conjunction with user-specific analysis/evaluation modules are included in Part II of this Configuration File.
Download
Download and Install RCMES
If you have not already done so, please review Getting Started with RCMES and Download RCMES using either VM or Easy OCW.
Download Model and Observation Datasets for Tutorial
Next, CLICK HERE to download the data for this tutorial.
If you are using VM for this tutorial, place the CORDEX-Africa_data folder within your shared data folder that you set up during the VM Install. If you have restarted your machine since the last tutorial, you will need to remount your data folder.
If you are using Easy OCW for this tutorial, you will need to save your data to an appropriate place. It is recommended that you save your data in the /climate/RCMES/data folder.
Configuration Files
The configuration files for this tutorial are found within your configuration files folder called NASA_downscaling_project_Part1.
In your terminal, navigate to the NASA_downscaling_project_Part1 folder.
cd rcmes/climate/RCMES/configuration_files/NASA_downscaling_project_Part1
Type the following to see all of the example configuration files in the folder.
ls -l
If you are having difficulty, please refer to the Configuration File Training for help.
Running Configuration Files
Example 1 - Western United States (RCMED Observation)
This example shows the use of a configuration file to evaluate the winter-season (November to March) precipitation over the western United States region from multiple model simulations in the NASA downscaling project. The reference data is the NASA TRMM precipitation in the RCMES database, RCMED. All model data reside on user's local disk.
Navigate to the directory where the configuration files are saved.
cd RCMES/configuration_files/NASA_downscaling_project_Part1
Use the following command to list the configuration files in the folder.
ls -l
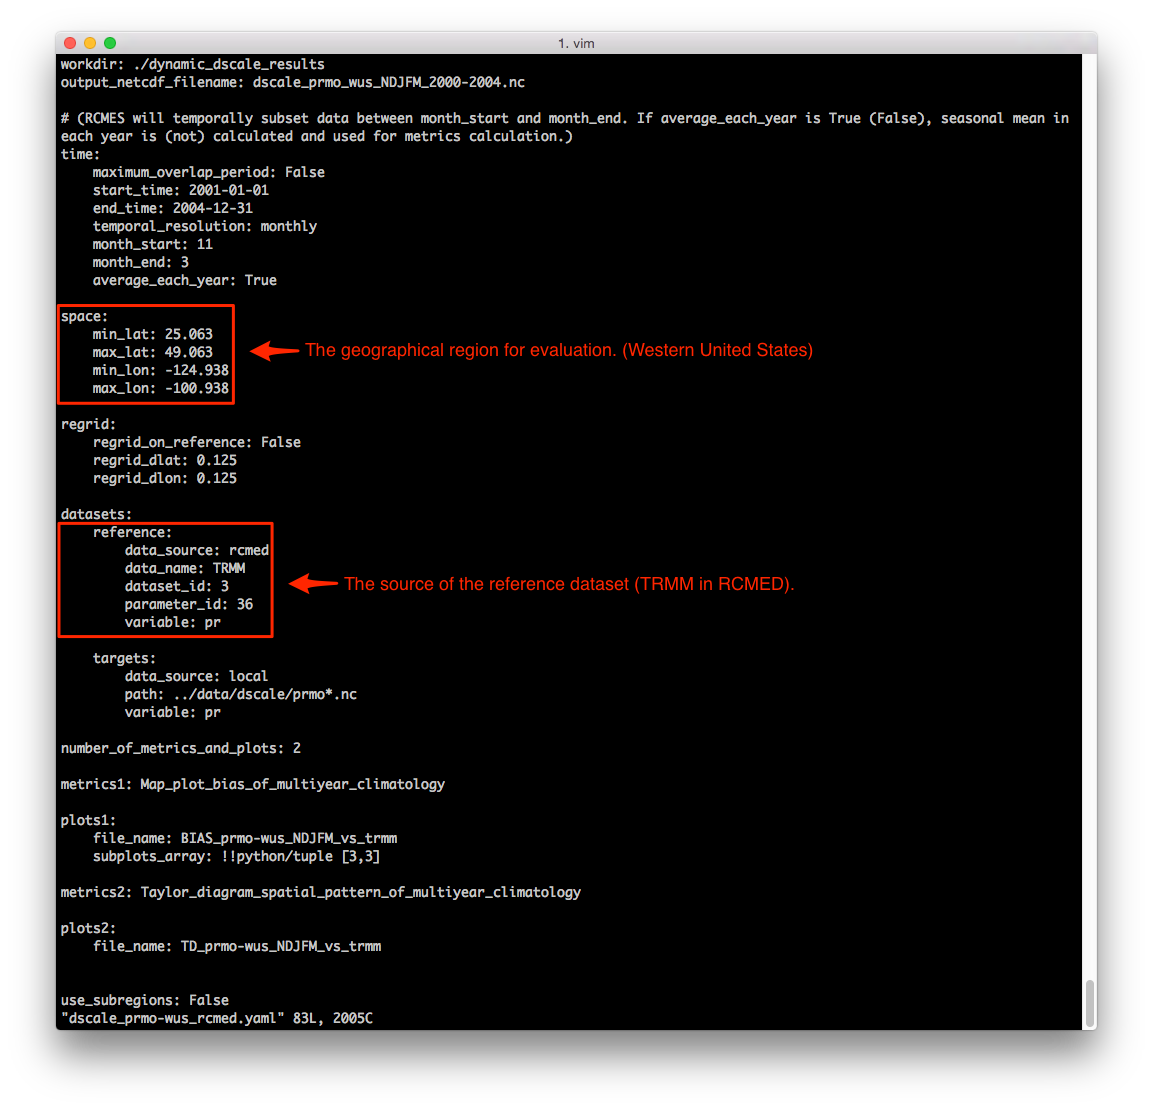
Example 1 utilizes the dscale_prmo-wus_rcmed.yaml configuration file. Use an editor to open the configuration file. Change the working directory to where you want results files saved and change the target dataset path if you have saved your data in a different location than specifed above.
Make sure you are back in the RCMES folder and run the configuration file.
python run_RCMES.py configuration_files/NASA_downscaling_project_Part1/dscale_prmo-wus_rcmed.yaml
Go to the working directory specified in the configuration file to see the results:
- netCDF file of processed data ("dscale_prmo_wus_NDJFM_2000-2004.nc")
- plots of the specified metrics calculations ("BIAS_prmo-wus_NDJFM_vs_trmm.png" and "TD_prmo-wus_NDJFM_vs_trmm.png").
Note that the name of the data and plot files are specified in the configuration file used to run the job.
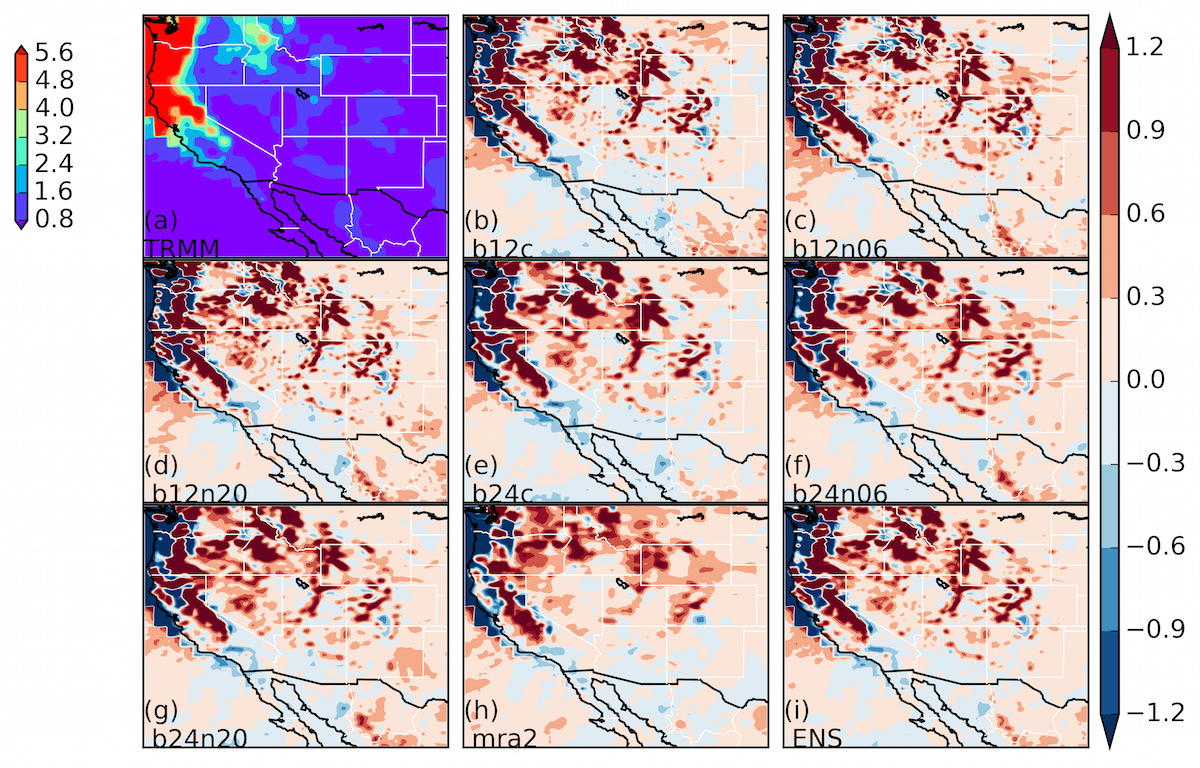 |
| (Fig. 1.1) The annual-mean precipitation (kg/m2) from November to March over western United States with regard to TRMM observation. |
 |
| (Fig. 1.2) The spatial correlations and standard deviation of the simulated normalized annual-mean precipitation (kg/m2) over the western United States with respect to the TRMM observation. |
Example 2 - Eastern United States (RCMED Observation)
This example shows how the evaluation area from western US to eastern US is changed, while maintaining all the other variables from Example 1. To change the evaluation area, this configuration file changes the spatial parameters "min_lon" and "max_lon" in the "space" group. The "min_lat" and/or "max_lat" parameters in the "space" group can also be adjusted if the user desires.
Navigate to the directory where the configuration files are saved.
cd RCMES/configuration_files/NASA_downscaling_project_Part1
Use the following command to list the configuration files in the folder.
ls -l
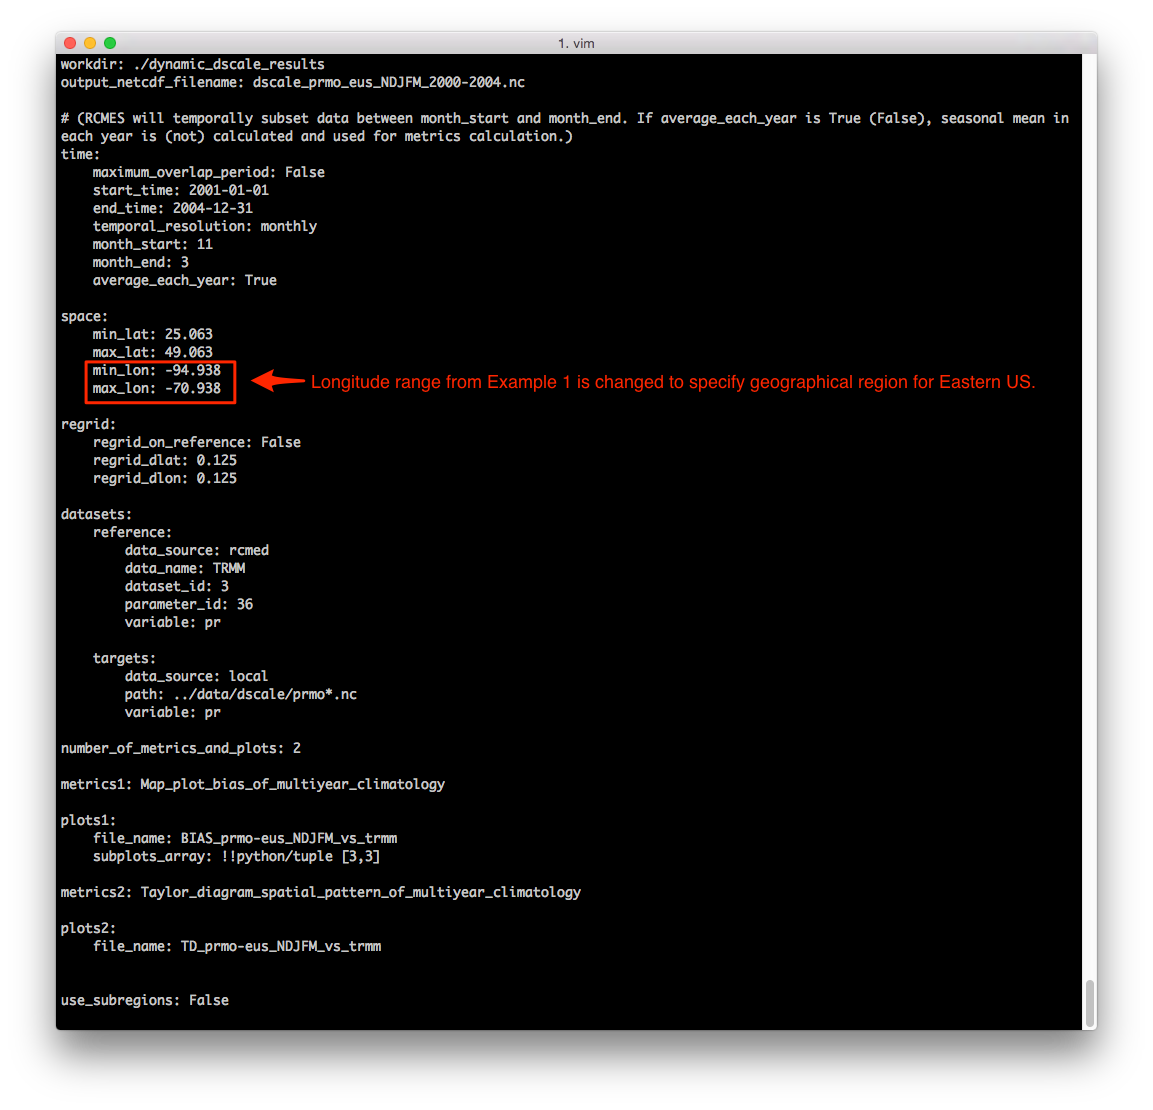
Example 2 utilizes the dscale_prmo-eus_rcmed.yaml configuration file. Use an editor to open the configuration file. Change the working directory to where you want results files saved and change the target dataset path if you have saved your data in a different location. Note that the longitude values have been changed to specify the geographical region for eastern US.
Make sure you are back in the RCMES folder and run the configuration file.
python run_RCMES.py configuration_files/NASA_downscaling_project_Part1/dscale_prmo-eus_rcmed.yaml
Go to the working directory specified in the configuration file to see the results:
- netCDF file of processed data ("dscale_prmo_eus_NDJFM_2000-2004.nc")
- plots of the specified metrics calculations ("BIAS_prmo-eus_NDJFM_vs_trmm.png" and "TD_prmo-eus_NDJFM_vs_trmm.png").
Note that the name of the data and plot files are specified in the configuration file used to run the job.
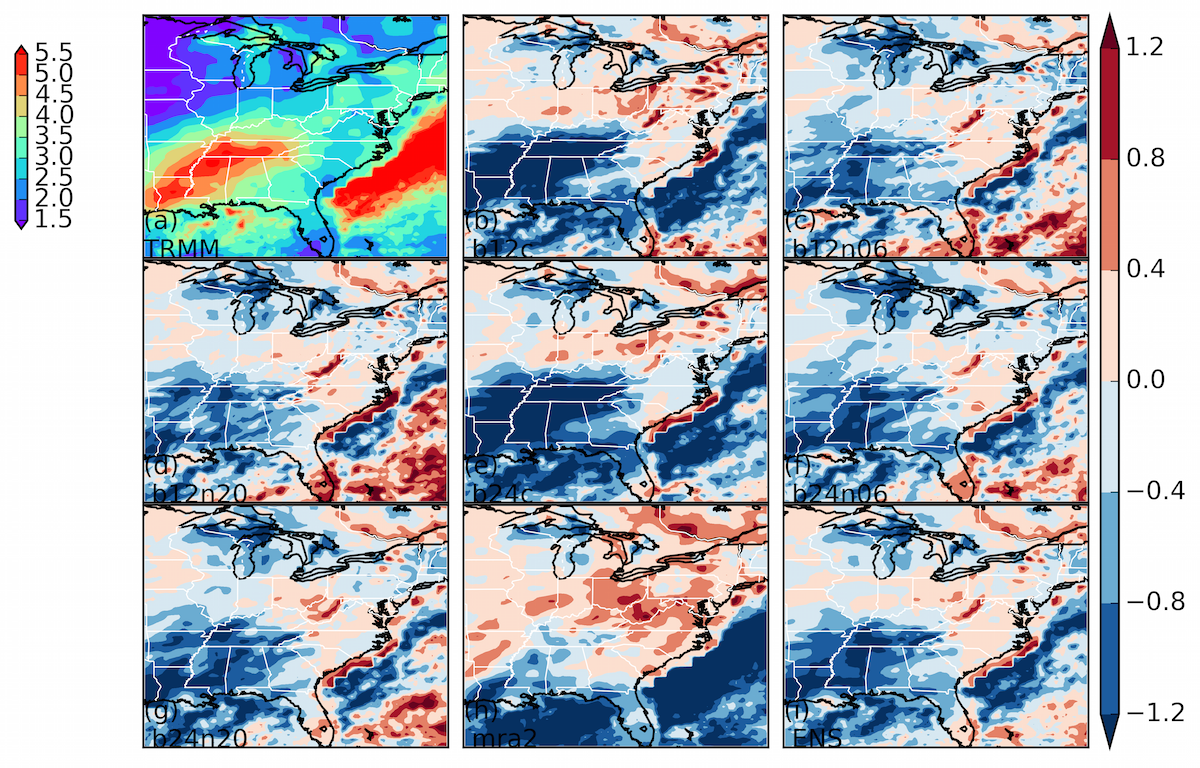 |
| (Fig. 2.1) The annual-mean precipitation (kg/m2) from November to March over eastern United States with regard to TRMM observation. |
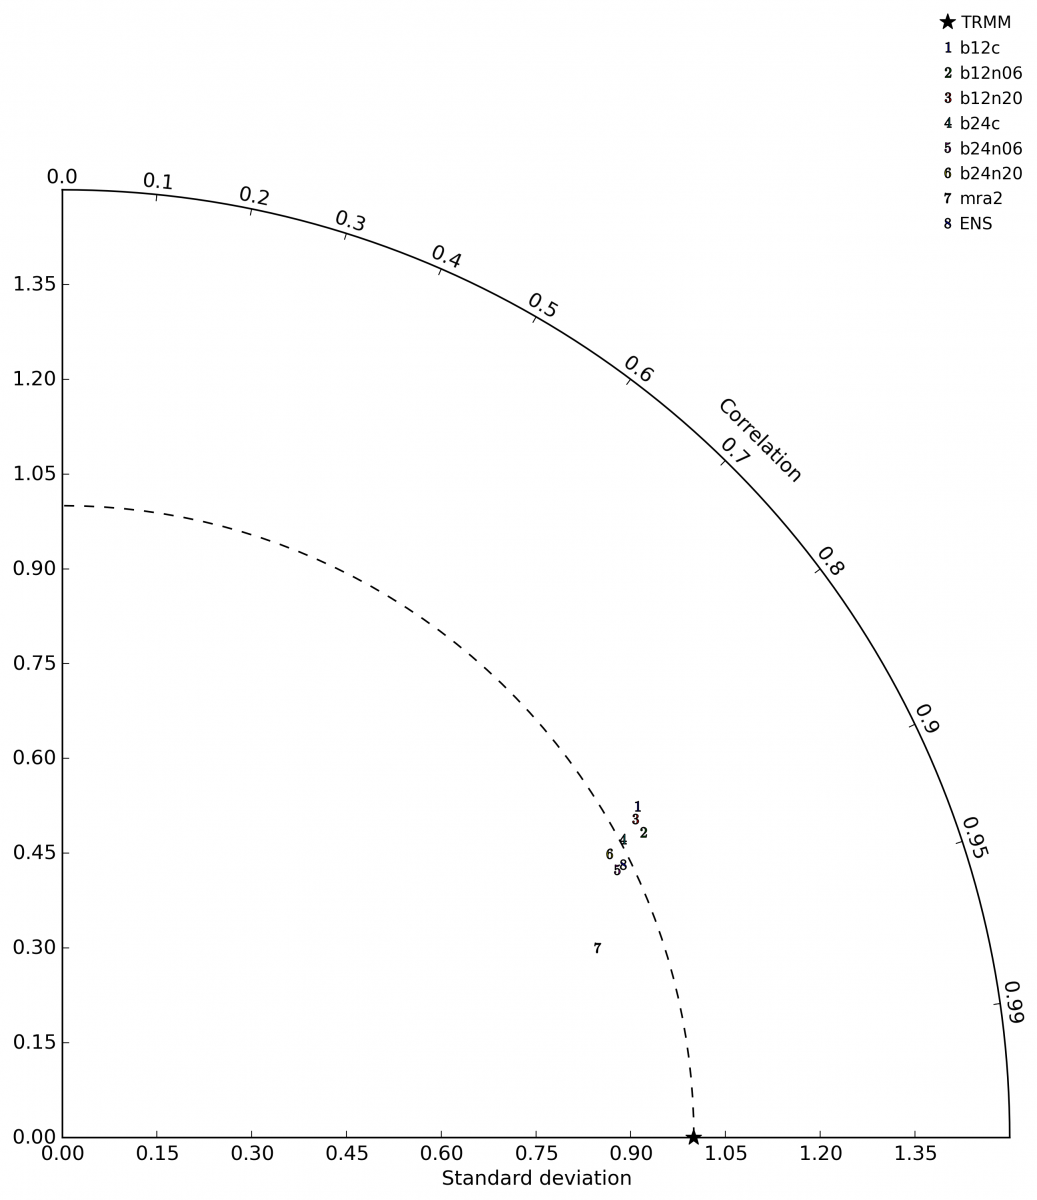
 |
| (Fig. 2.2) The spatial correlations and standard deviation of the simulated normalized annual-mean precipitation (kg/m2) over the eastern United States with respect to the TRMM observation. |
Example 3 - Western United States (observation dataset saved locally)
This example shows a way to use a reference data from users' local storage. The configuration file below is constructed by replacing the reference data in Examples 1 and 2, the NASA TRMM stored in RCMED, with the NASA-NLDAS stored in user's local disk as shown in the red boxes in the "datasets" block.
Navigate to the directory where the configuration files are saved.
cd RCMES/configuration_files/NASA_downscaling_project_Part1
Use the following command to list the configuration files in the folder.
ls -l
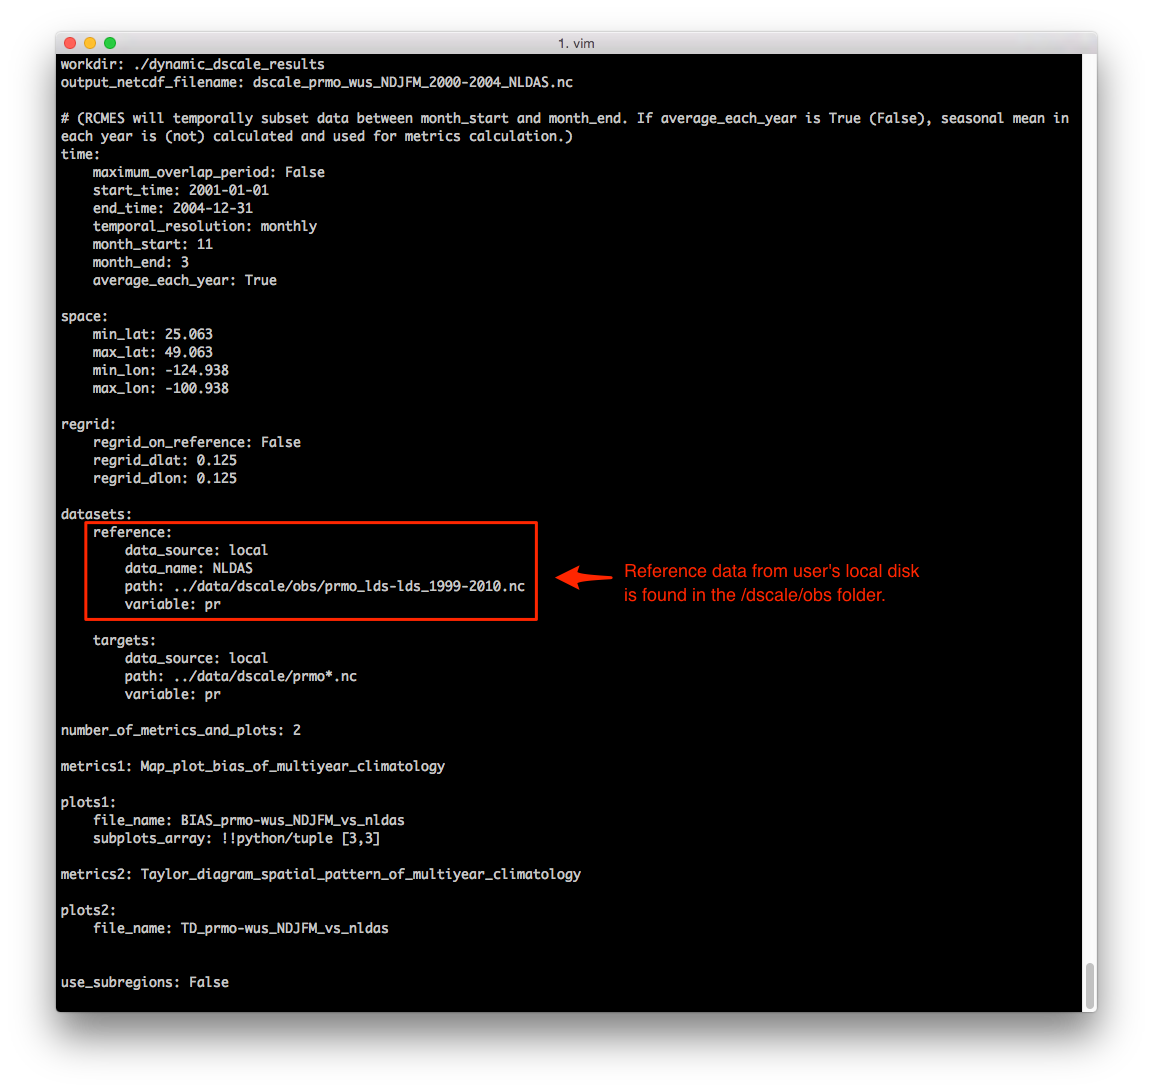
Example 3 utilizes the dscale_prmo-wus_local.yaml configuration file. Use an editor to open the configuration file. Change the working directory to where you want results files saved and change the target dataset path if you have saved your data in a different location. In order to use the reference data stored on the local disk, the reference data specification in the "datasets" block is modified as shown in the example below. Make sure that the file path is specified correctly. The evaluation region is the same as in Example 1 (western US).
Make sure you are back in the RCMES folder and run the configuration file.
python run_RCMES.py configuration_files/NASA_downscaling_project_Part1/dscale_prmo-wus_local.yaml
Go to the working directory specified in the configuration file to see the results:
- netCDF file of processed data ("dscale_prmo_wus_NDJFM_2000-2004_NLDAS.nc")
- plots of the specified metrics calculations ("BIAS_prmo-wus_NDJFM_vs_nldas.png" and "TD_prmo-wus_NDJFM_vs_nldas.png").
Note that the name of the data and plot files are specified in the configuration file used to run the job.
The output data and plot files are stored in the working directory. Note that biases are not calculated over ocean surfaces as the NASA NLDAS data covers only land surfaces. Also note that, compared to Example 1, the evaluation of spatial variability (the Taylor diagram) varies substantially depending on the reference data. RCMES calculates metrics for the regions where both the reference and model data coexist; any part of the evaluation domain where either reference or model data are absent is left blank in the plot.
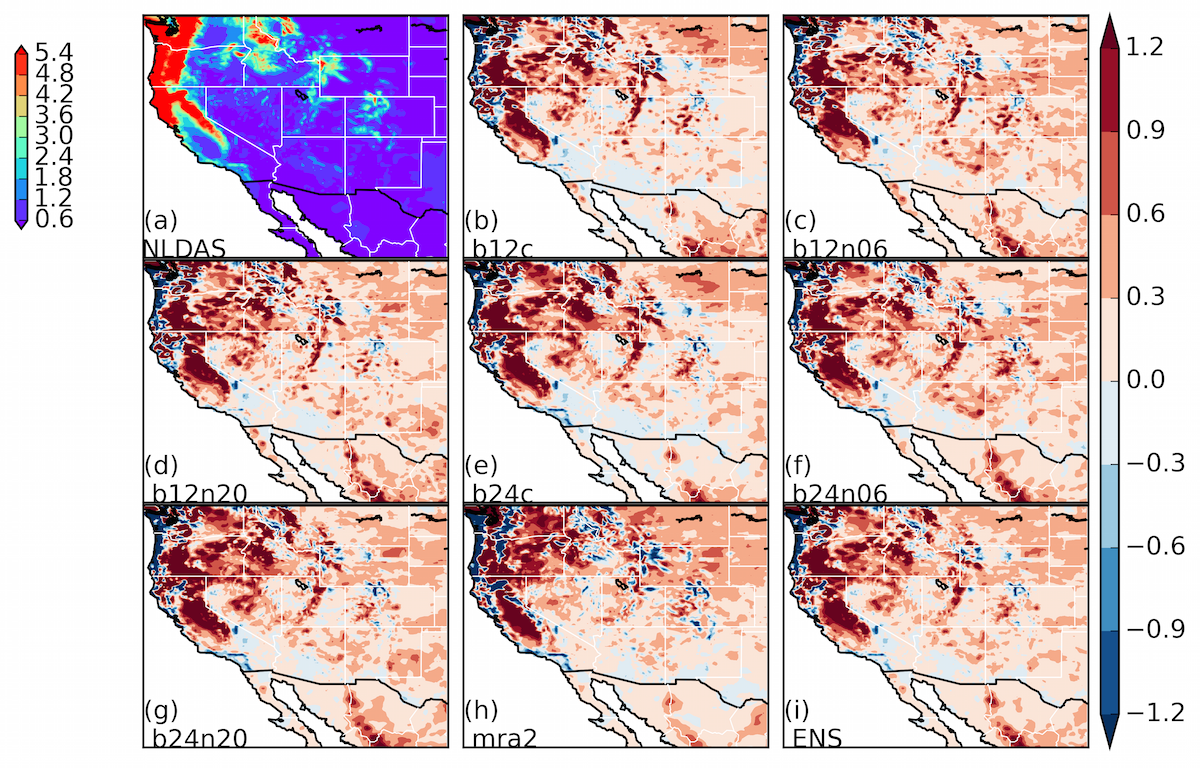 |
| (Fig. 3.1) The annual-mean precipitation (kg/m2) from November to March over western United States with regard to NLDAS observation. |
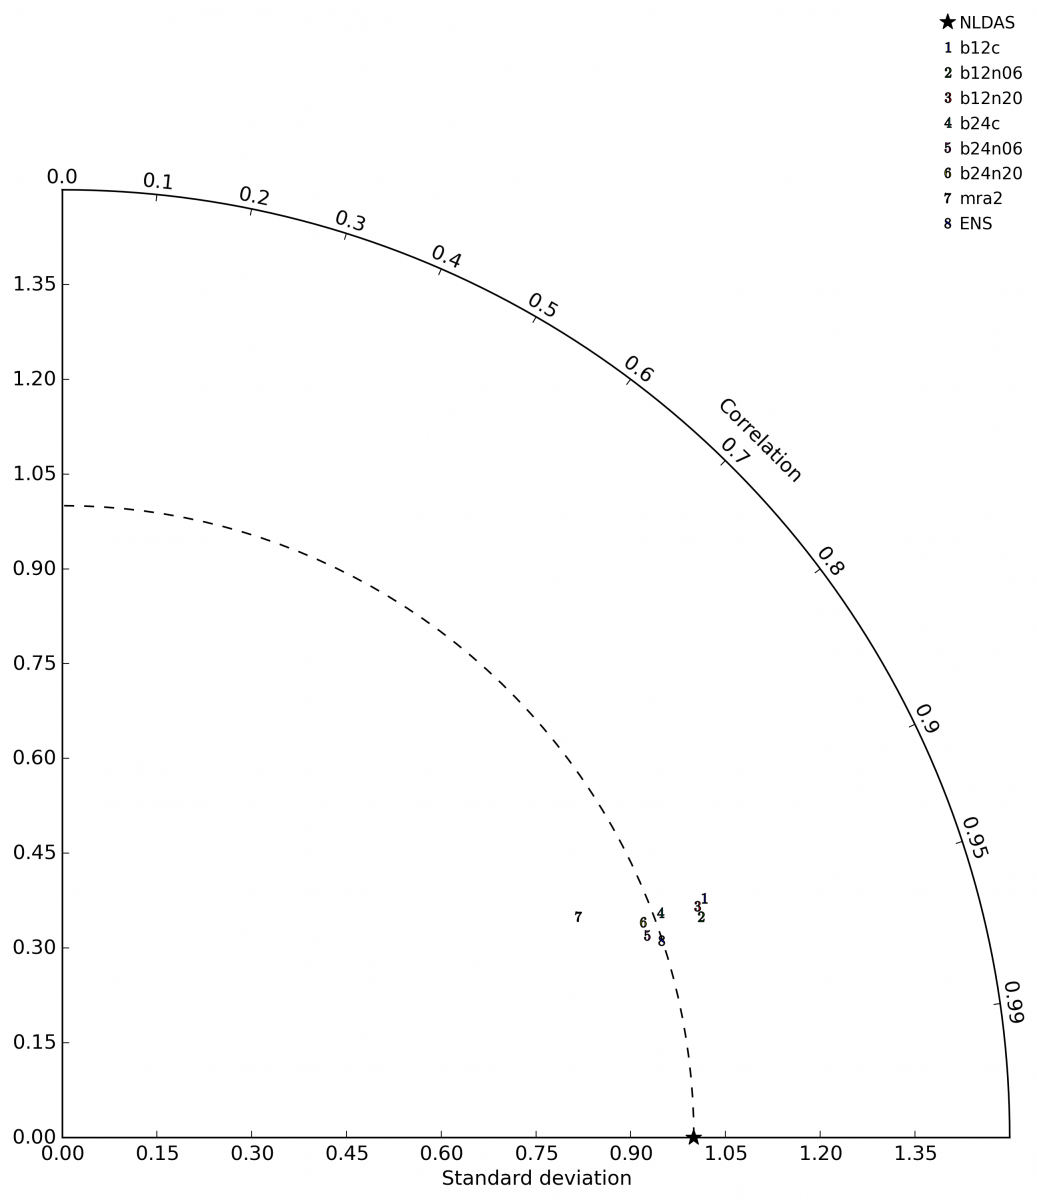 |
| (Fig. 3.2) The spatial correlations and standard deviation of the simulated normalized annual-mean precipitation (kg/m2) over the western United States with respect to the NLDAS observation. |
Example 4 - Inter-comparison of multiple observations
Examples 1 and 3 show that evaluation results can vary depending on the selection of the reference data. Thus, examining the differences between available reference datasets is desirable for understanding potential uncertainties in the evaluation. Example 4 shows how to inter-compare multiple observation datasets using RCMES. In this example, we use TRMM as the reference data and compare other observations (NLDAS2, MERRA2, and PRISM) against TRMM in the same way as model data are evaluated. In the configuration file below, TRMM is assigned as the reference data. The three observation datasets residing in the user's local disk are then assigned to the target datasets.
Navigate to the directory where the configuration files are saved.
cd RCMES/configuration_files/NASA_downscaling_project_Part1
Use the following command to list the configuration files in the folder.
ls -l
Example 4 utilizes the dscale_wus_prec_trmm_vs_nldas.yaml configuration file. Use an editor to open the configuration file. Change the working directory to where you want results saved and change the target dataset path if you have saved your data in a different location. Note that the reference datasets are found within the obs folder in the downloaded data.

Make sure you are in the RCMES folder and run the configuration file.
python run_RCMES.py configuration_files/NASA_downscaling_project_Part1/dscale_wus_prec_trmm_vs_nldas.yaml
Go to the working directory specified in the configuration file to see the results:
- netCDF file of processed data ("dscale_prmo_NDJFM_nldas_vs_trmm.nc")
- plots of the specified metrics calculations ("BIAS_prmo-wus_NDJFM_nldas_vs_trmm.png" and "TD_prmo-wus_NDJFM_nldas_vs_trmm.png").
Note that the name of the data and plot files are specified in the configuration file used to run the job.
The output files present the differences between the three target datasets (NLDAS2, MERRA2, and PRISM) and the reference data (TRMM). The characteristics of spatial variability of individual target datasets relative to the reference data are also presented using a Taylor diagram similarly as in model data evaluations in the examples above.
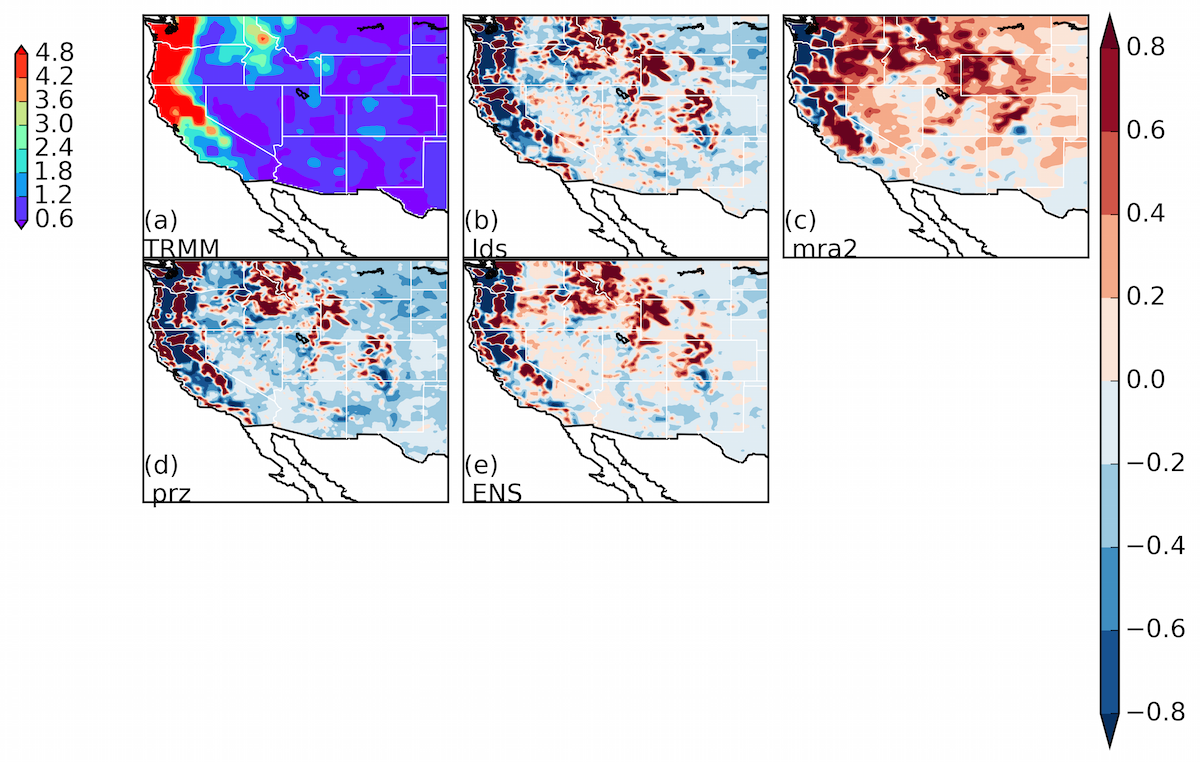 |
| (Fig. 4.1) The annual-mean precipitation (kg/m2) from December to March over western United States between NLDAS2, MERRA2, PRISM, and TRMM observations. |
 |
| (Fig. 4.2) The spatial correlations and standard deviation of the simulated normalized annual-mean precipitation (kg/m2) over the western United States between NLDAS2, MERRA2, PRISM, and TRMM observations. |
Helpful Tips
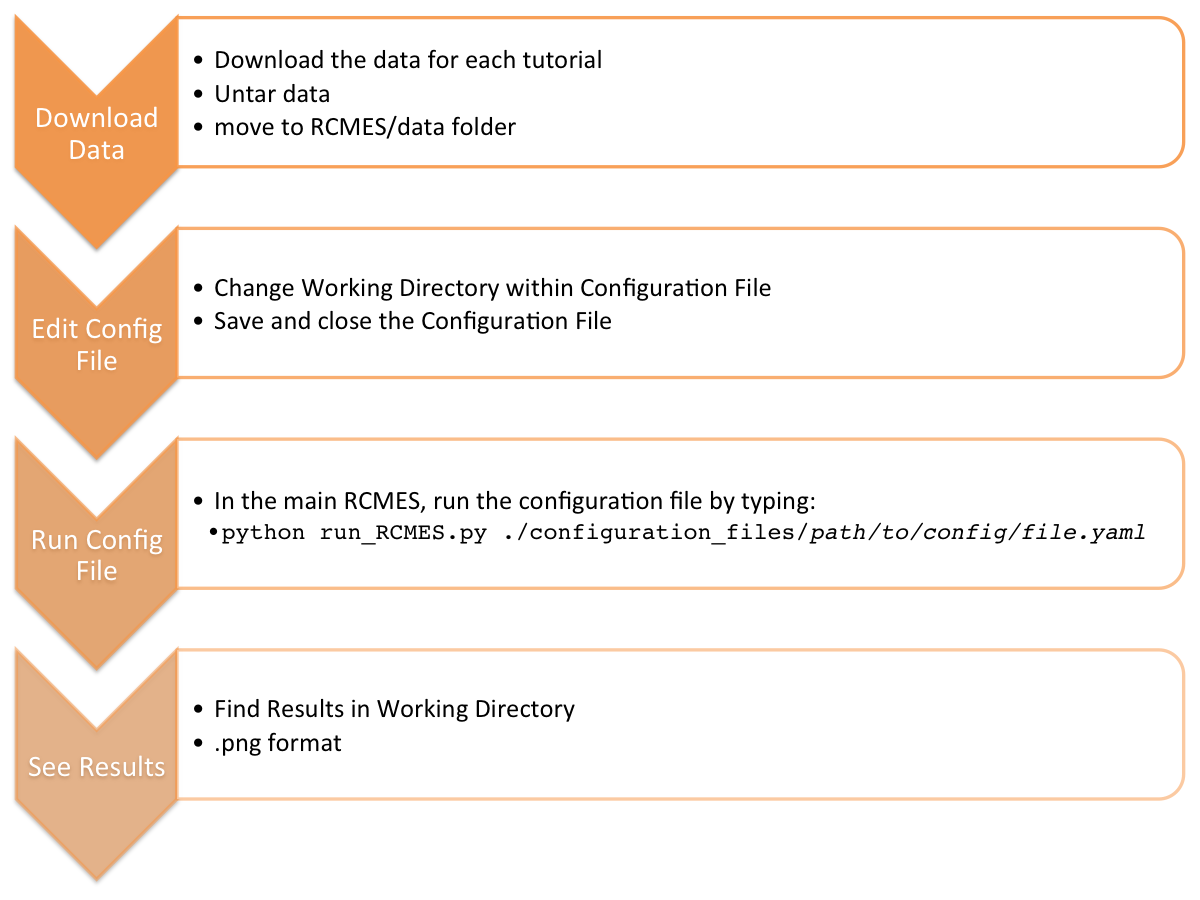
- Configuration File Workflow