
State, national and international assessment reports (ARs) are growing in their importance to provide a scientific resource for understanding and assessing the impacts of climate variability and change on our society and natural resources. Central to these ARs are the quantitative climate projections based on complex, yet physically based, global and regional climate models (GCMs and RCMs). Because of the critical role these models have to assessment process it is a high priority to bring as much observational scrutiny to them as possible. This requires the systematic application of observations from satellite and state-of-the-art reanalysis products as well as in-situ observation networks. Enabling such multi-variate evaluations is essential for advancing model fidelity, performing quantitative model comparison, evaluation and uncertainty analyses, and constructing multi-model ensemble projections. These capabilities are all necessary to provide a comprehensive characterization of future climate that can lead to an informed decision-making process. Figure 1 provides a schematic illustration of this process, noting in red where observations of the climate system play a key role: 1) characterizing climate variability and change, 2) providing the means for developing and evaluating GCMs, and 3) providing the means for developing and evaluating RCMs, with the latter being an essential component for bridging global climate variability/change with local and regional decision-making.
Figure 1. Schematic showing in red where observations play a key role in the assessment process; typically carried out from left to right, with the goal of a thoroughly informed process on the far right.
While systematic, multi-model experimentation and evaluation have been undertaken for years and in many facets for global-scale assessments (e.g., CMIP for IPCC), the development and application of infrastructure for a systematic, observation-based evaluation of RCMs is less mature, with a significant portion of satellite and other data being highly underutilized. Recognizing this need, a team of scientists and technologists from NASA's & Caltech's Jet Propulsion Laboratory (JPL) and the University of California, Los Angeles (UCLA) via the Joint Institute for Regional Earth System Science and Engineering (JIFRESSE) have, with initial seed funding from the American Recovery and Reinvestment Act (ARRA) and internal JPL investment funds, along with support and investments noted in the Acknowlegements below, developed a Regional Climate Model Evaluation System (RCMES). The objective of RCMES is to provide a core model evaluation capability for the regional climate community, one that for example can facilitate the systematic evaluation of models that provide input into assessments such as the IPCC Assessment Reports (e.g. IPCC AR5), U.S. National Climate Assessment (NCA), as well as more localized government agencies (e.g. California Energy Commission). Visit the RCMES Collaborations page to find out how RCMES is being used to support such climate assessment activities.
RCMES is a combined database-toolkit designed to facilitate access to observational data and a basic computational toolkit for handling the database and calculating model performance metrics with special emphasis on handling a variety of remote sensing, reanalysis and in-situ data. The system, depicted in Figure 2, has complete end-to-end capabilities in terms of ingesting observational and model data (e.g. from obs4MIPs or CMIP on the ESGF), performing temporal and spatial sub-setting and formatting compatibility steps, calculating model performance metrics, and plotting and/or outputting the results. Its inherent design makes it easily extensible for including more observations, diagnostics, and plotting/outputting capabilities. Further technical details of RCMES can be found on the Support page(s).
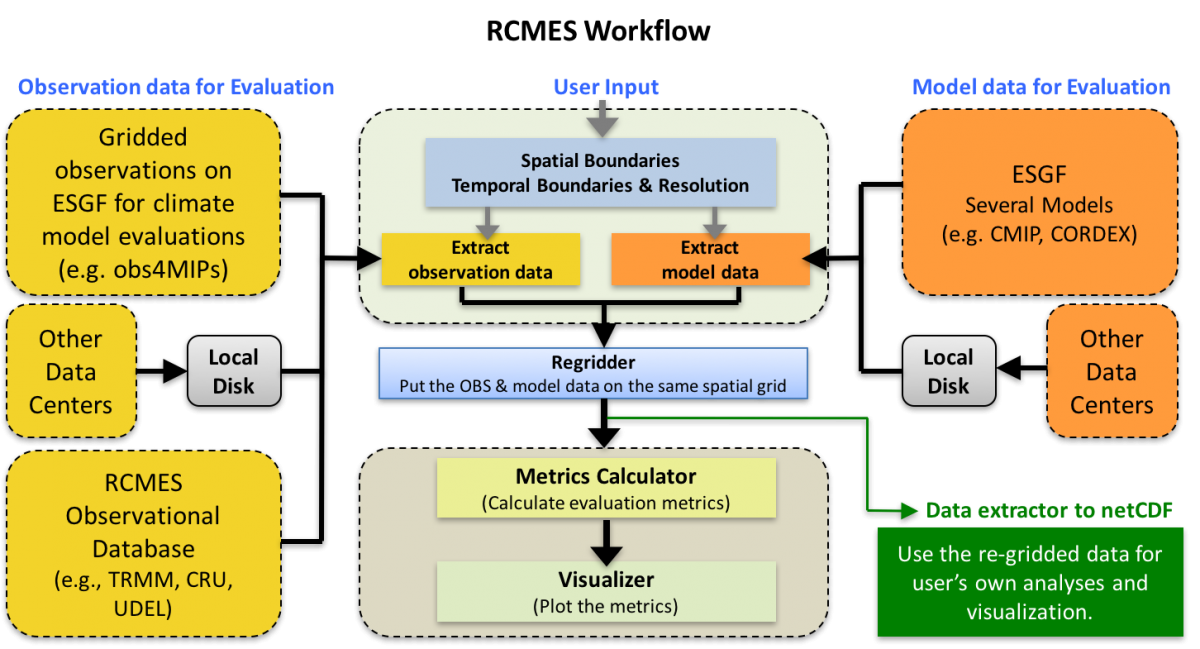
Figure 2. A schematic illustration of the outline and data flows within RCMES.
RCMES provides the means to evaluate the regional-scale fidelity of both GCMs and RCMs. The RCM case includes a number of paradigms which are schematically illustrated in Figure 3. Each is necessarily based on the RCM's representation of the late 20th century, when a multitude of observations exist, many of which are incorporated into RCMES (see Data page). Instance A evaluates the regional-scale fidelity of a course-grid GCM over a selected region. Instance B evaluates finer-grid RCMs for the case when the lateral boundary conditions are provided by re-analysis products; this tests the fidelity of RCMs alone. Instance C evaluates finer-grid RCMs for the case when the lateral boundary conditions are provided by the GCMs; this tests the fidelity of RCMs in conjunction with GCMs. Since instances A and C are the basis for seasonal, decadal and centennial climate predictions, it is imperative to characterize their strengths and shortcomings via observations for the present-day climate in order to quantify their uncertainties for use in future projections. Instance B isolates the biases of the RCM from those associated with a driving GCM. Each of these instances can be systematically evaluated via RCMES, and uniformly scored across models and data sets. In fact, the production of portrait and Taylor diagrams, such as those illustrated in Figure 4 that were developed for global model assessment (e.g., CMIP3 for IPCC) by PCMDI, but tailored for regional model assessment, is a key capability and use of RCMES.
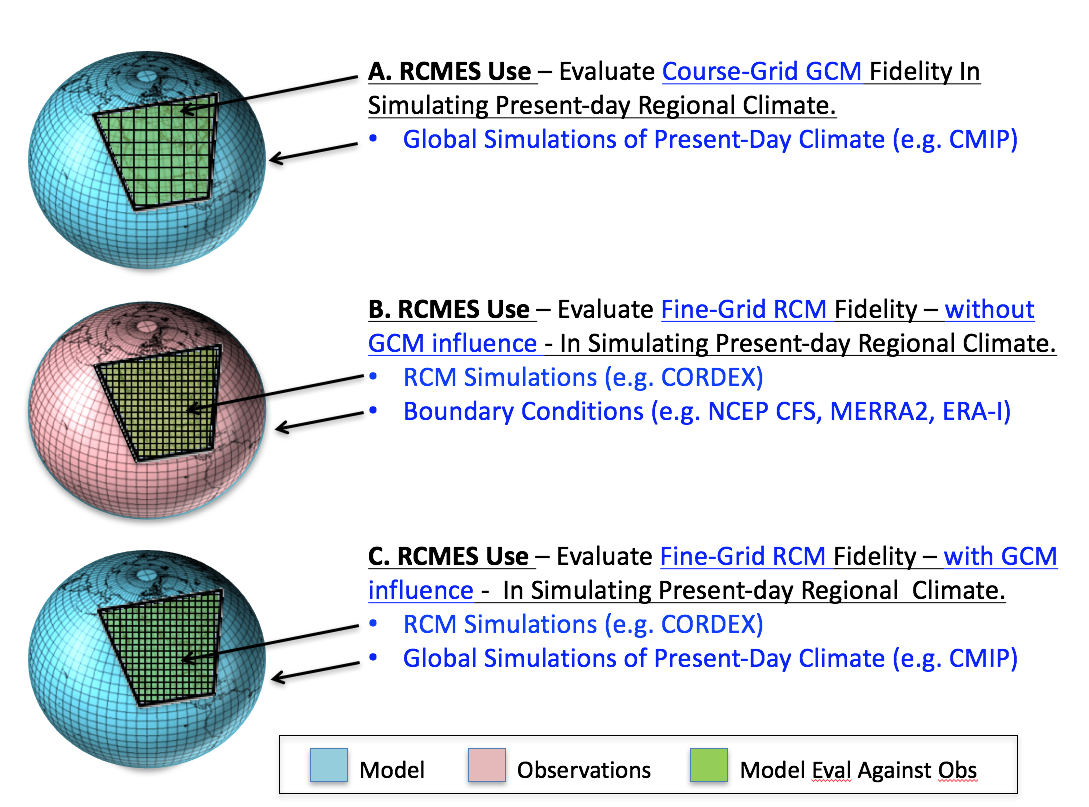
Figure 3. Schematic illustrating how observations can be exploited for regional-scale model evaluation, in this case shown over North America. (A, top) Evaluate course-grid GCMs (e.g., CMIP). (B, middle) Evaluate fine-grid RCMs (e.g., CORDEX, NARCCAP) with boundary conditions (BCs) supplied by re-analysis. (C, bottom) Evaluate fine-grid RCMs with BCs supplied by GCM.

Figure 4. (left) Portrait diagram display of relative error metrics for 20th century CMIP3 annual cycle, climatology (1980...1999) for zonal mean (with bias removed). A value of -0.2 means that the model has an error 20% smaller than the typical model error for that quantity. Each grid square is split by a diagonal in order to show the relative error with respect to both the primary (upper left triangle) and the alternate (lower right triangle) reference data sets. (right) Multivariable Taylor diagram of the 20th century CMIP3 annual cycle climatology (1980…1999) for NHEX (20N…90N). Each dot represents an individual simulation made with a particular model, each triangle represents the ensemble model mean. Gleckler et al. [2008].
Acknowledgements:
Support provided by NASA Earth Sciences Division, NASA NCA (ID: 11-NCA11-0028) and NASA's Advanced Information Systems Technology (AIST) program (ID: AIST-QRS-12-0002) and through the NASA Computational Modeling and Cyberinfrastructure (CMAC) program (11-CMAC11-0011). In addition, funding is provided by the National Science Foundation ExArch program (ID: 1125798), a component of the G8 Initiative. Valuable contributions to the RCMES activity have come from support from and/or collaobration with the World Climate Research Program (WCRP) Coordinated Regional Climate Downscaling Experiment (CORDEX), the North American Regional Climate Change Assessment Program (NARCCAP), the Climate & Development Knowledge Network (CDKN) and the University of Cape Town, and PCMDI through support of the obs4MIPs activity.