
Quick Navigation
Download
Exploring the Example
Running the Example
Evaluation of CMIP5 Ability to Reproduce 20th Century Regional Trends in
Surface Air Temperature and Precipitation over CONUS
J. Lee, D.E. Waliser, H. Lee, P. Loikith, K.E. Kunkel
Submitted to Climate Dynamics
July 2017
Evaluating Climate Model Trends using RCMES
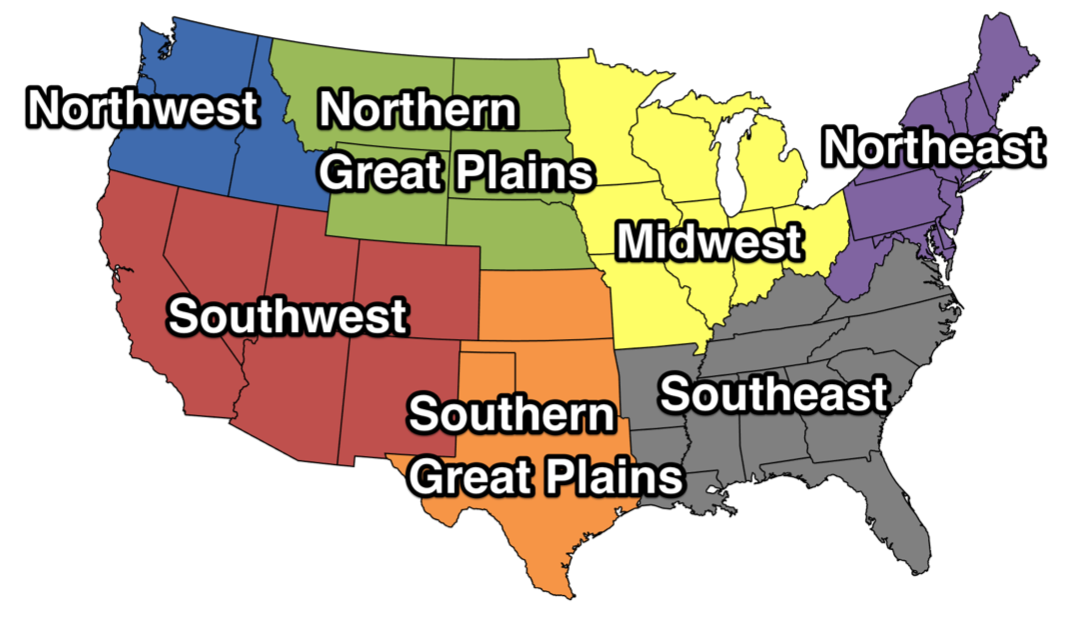
In this example, an ensemble of 10 CMIP5 models are evaluated against NOAA's new observational dataset, nClimGrid, over the contiguous United States using RCMES. Trends in near-surface air temperature are compared for the seven National Climate Assessment (NCA) regions.
Download
Download and Install RCMES
If you have not already done so, please review Getting Started with RCMES and Download RCMES using either VM or Easy OCW.
Download Data for Tutorial
CLICK HERE to download the data for this tutorial (file size is 2.5 GB, may take some time to download). Save your data to an appropriate place. It is recommended that you save the NCA-CMIP_examples folder within your RCMES folder.
Exploring the Example
Observation Data: nClimGrid
In the main RCMES folder, within the NCA-CMIP_examples folder, the nClimGrid folder contains the files:
| Filename | Description |
| nClimGrid_7regions_and_US_mask.nc | Mask of the U.S. and seven NCA regions |
| nClimGrid_tave_1895-2005.nc | Monthly near-surface temperature |
Model Data: CMIP5
In the main RCMES folder, within the NCA-CMIP_examples folder, the CMIP5_historical folder contains 10 CMIP5 models of average monthly near-surface temperature data:
| Models |
| BNU-ESM |
| CanESM2 |
| CNRM-CM5 |
| CSIRO-Mk3-6-0 |
| GISS-E2-H |
| HadCM3 |
| inmcm4 |
| MIROC-ESM |
| MPI-ESM-LR |
| NorESM1-M |
Working Example: temperature_trends_over_CONUS.py
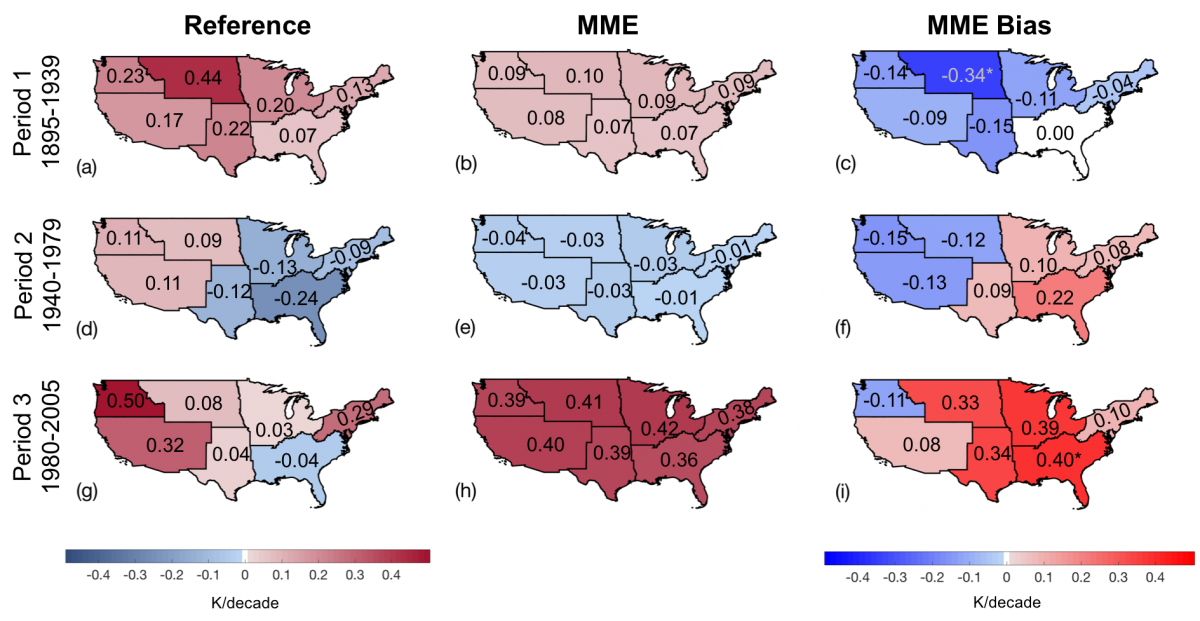
The provided code for this example is easily editable using a text editor such as vim or emacs. This allows the user to edit the existing configurations and/or add their own code to run the evaluation. This particular example compares the observation and model ensemble monthly temperature trends from 1980-2005 over the summer months (JJA).
Running the Example
In Terminal, navigate to the NCA-CMIP_examples folder:
cd RCMES/NCA-CMIP_examples
To run the example, enter the following prompt into the Terminal:
python temperature_trends_over_CONUS.py
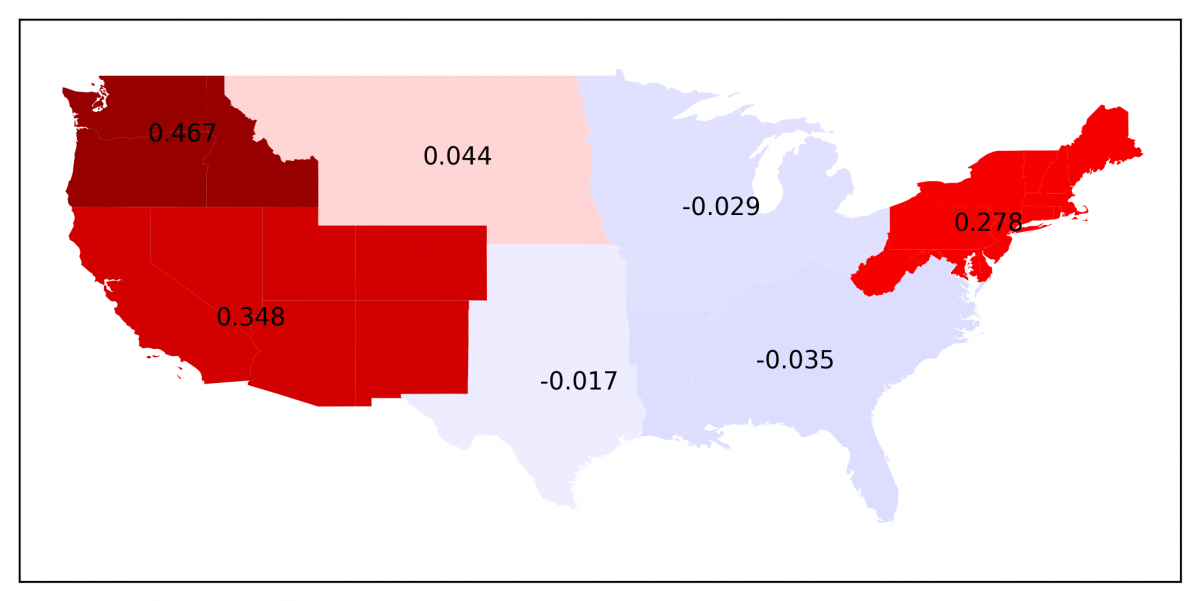
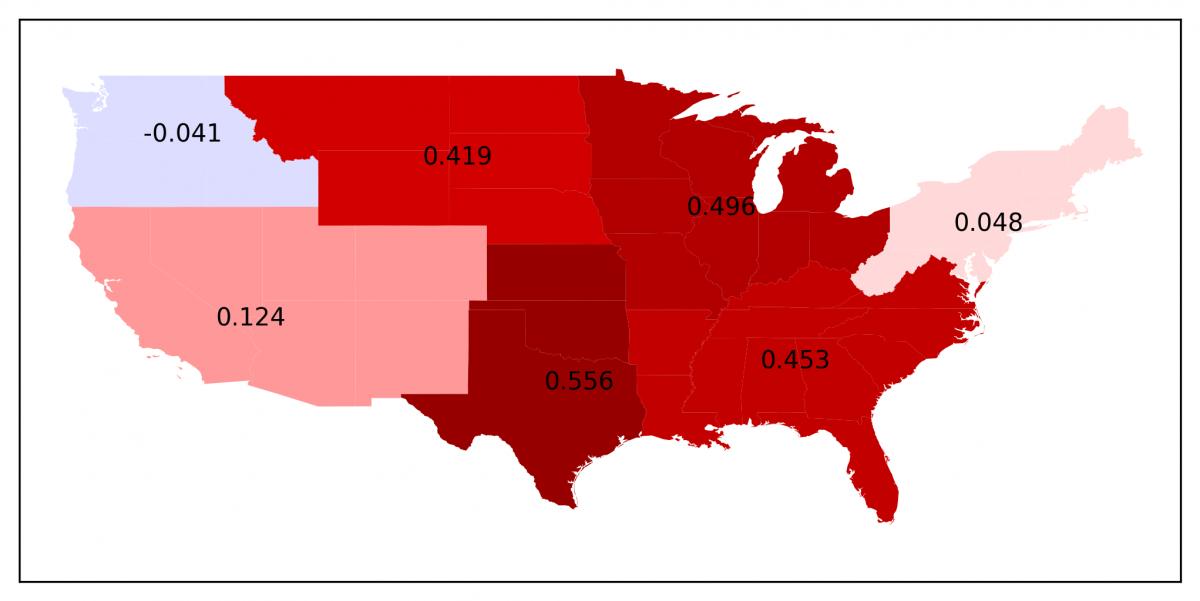
The evaluation will take a few minutes to run. When it is finished, the following plots will be found in the results folder.
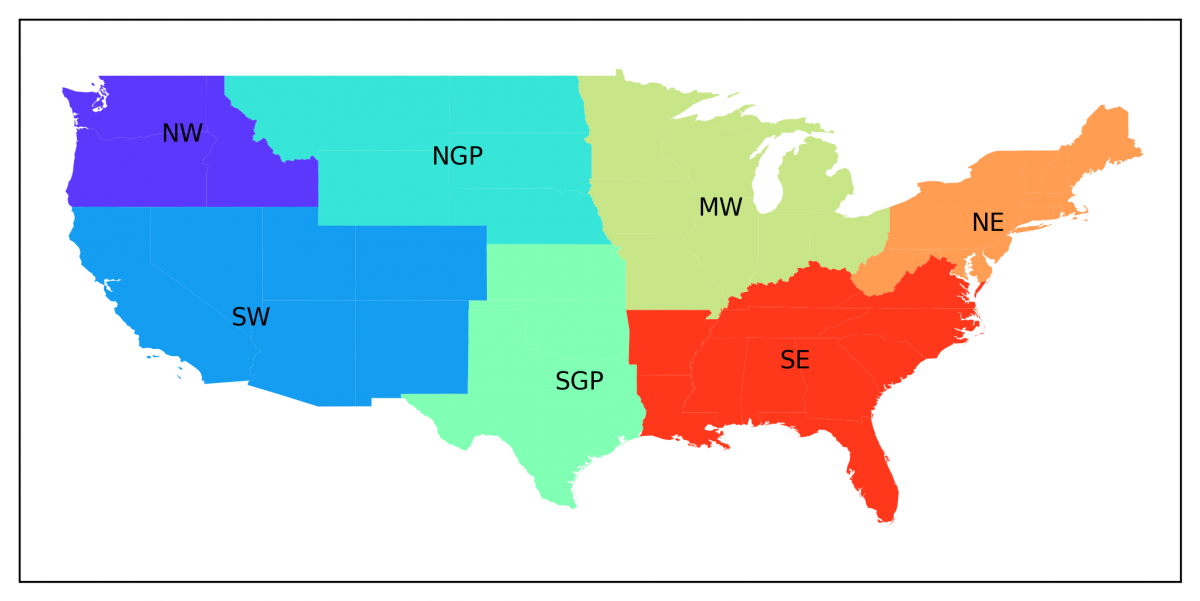 |
| (Fig. 1) Regions of analysis in this study, adapted from Janssen et al. 2014. |
| Observation | Model Ensemble | Bias | ||
 |
 |
 |
||
| (Fig. 2) The observation, model ensemble, and bias of JJA mean near-surface air temperature decadal trends for 1980-2005. | ||||
 |
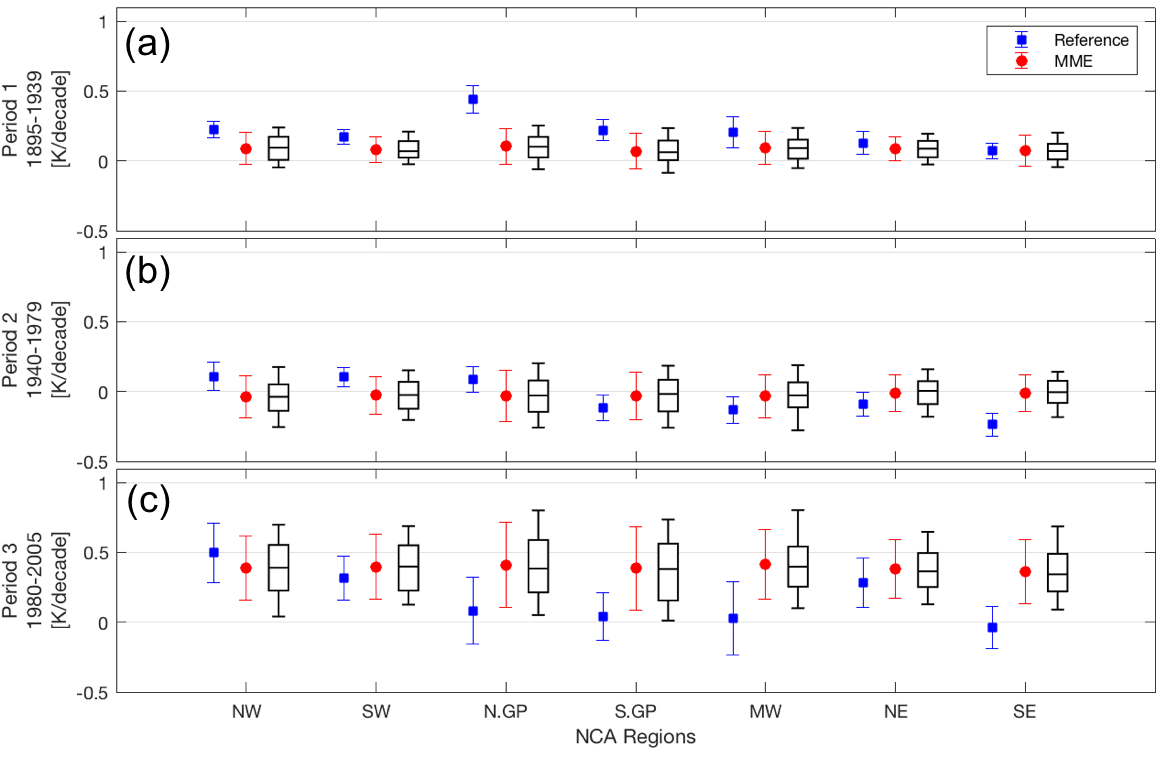
| (Fig. 3) Mean near-surface air temperature decadal trend and standard error of observation (red), bootstrap multi-model ensemble and standard error (blue), and box plot of individual model simulation decadal mean trend by regions for JJA 1980-2005. |