Regional Climate Mode Evaluation SystemRCMES
Configuration Files (or "config" files) are templates that allow for user defined input to drive a model evaluation. RCMES config files utilize the yaml file format as indicated by the .yaml extension on example config files provided here. Config files allow you to define the evaluation domain, the time period of evaluation, regridding options, and what performance metrics to output. Once you have completed the config file input requests, RCMES will read the config file and complete the analysis.
The following is a config file with its parameters noted by red boxes.
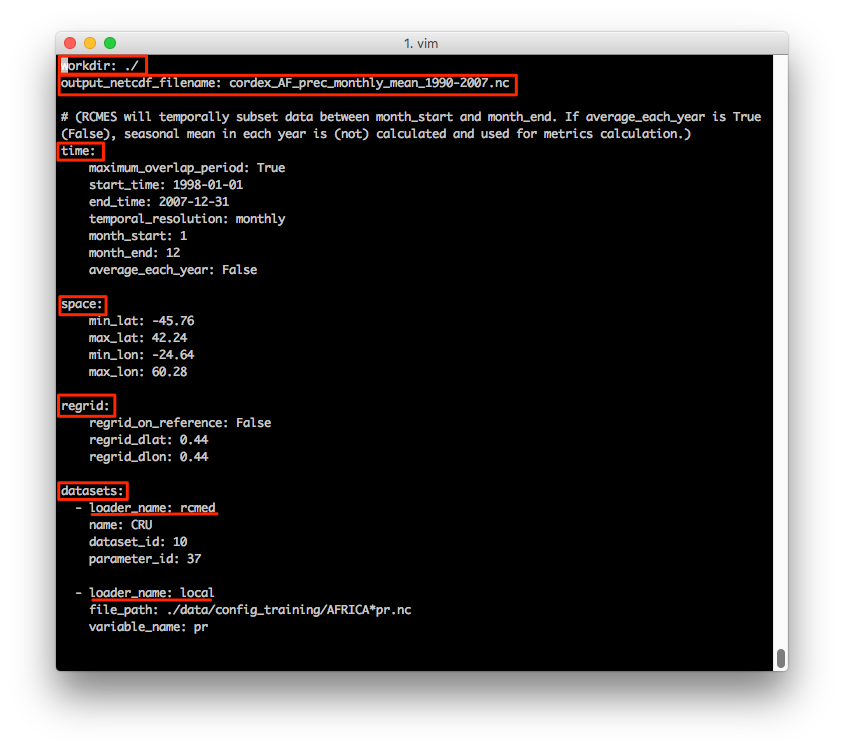

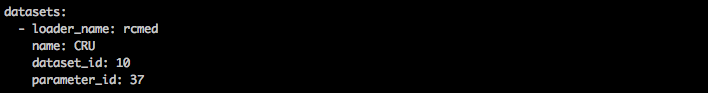
Option 1: use RCMED
Option 2: use local file; the asterisk (*) is a wildcard and RCMES will search for all files with a path identical to the input, ignoring the differences where the asterisk placeholder is

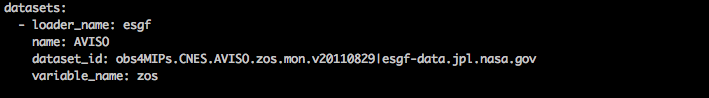
Option 3: use ESGF
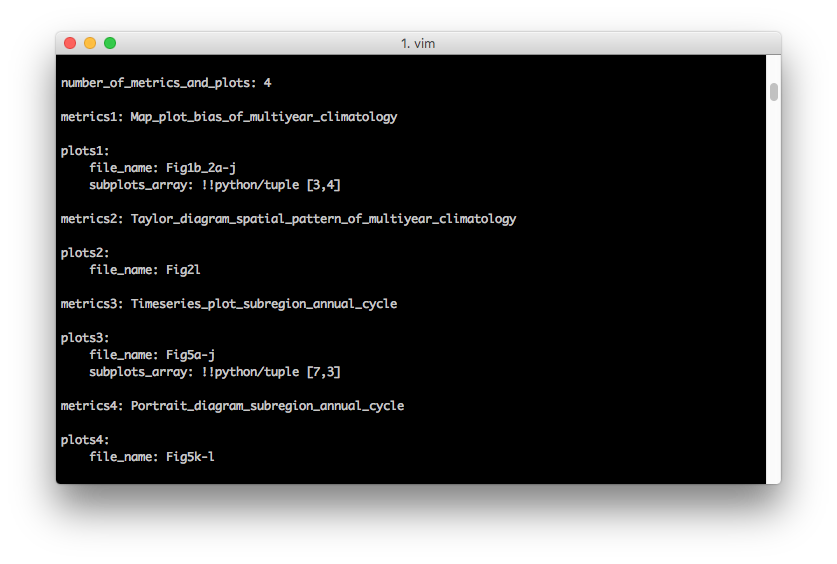
This section of the config file indicates which metrics and plots are produced. Here, you can select up to 4 metrics and plots. For example, if 3 is chosen, then metrics 1-3 and plots 1-3 are produced.

plots1 - produces a bias plot of the observation against individual models
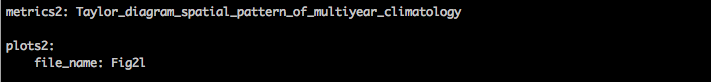
plots2 - produces a taylor diagram of spatial pattern correlations and standardized deviations with respect to the observation

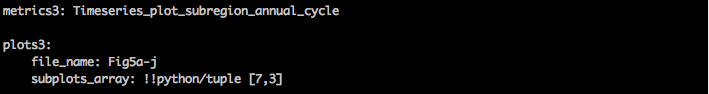
plots3 - produces a time series annual plot of all defined subregions
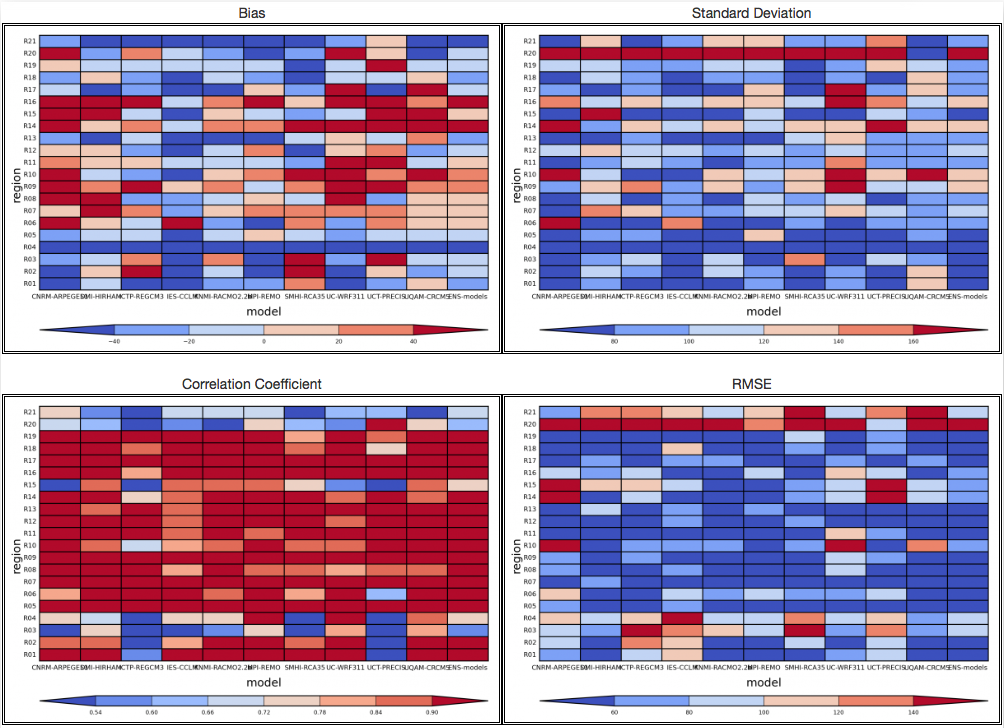
plots4 - produces 4 portrait diagrams for all defined subregions

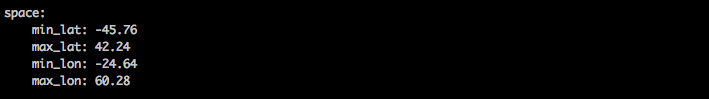
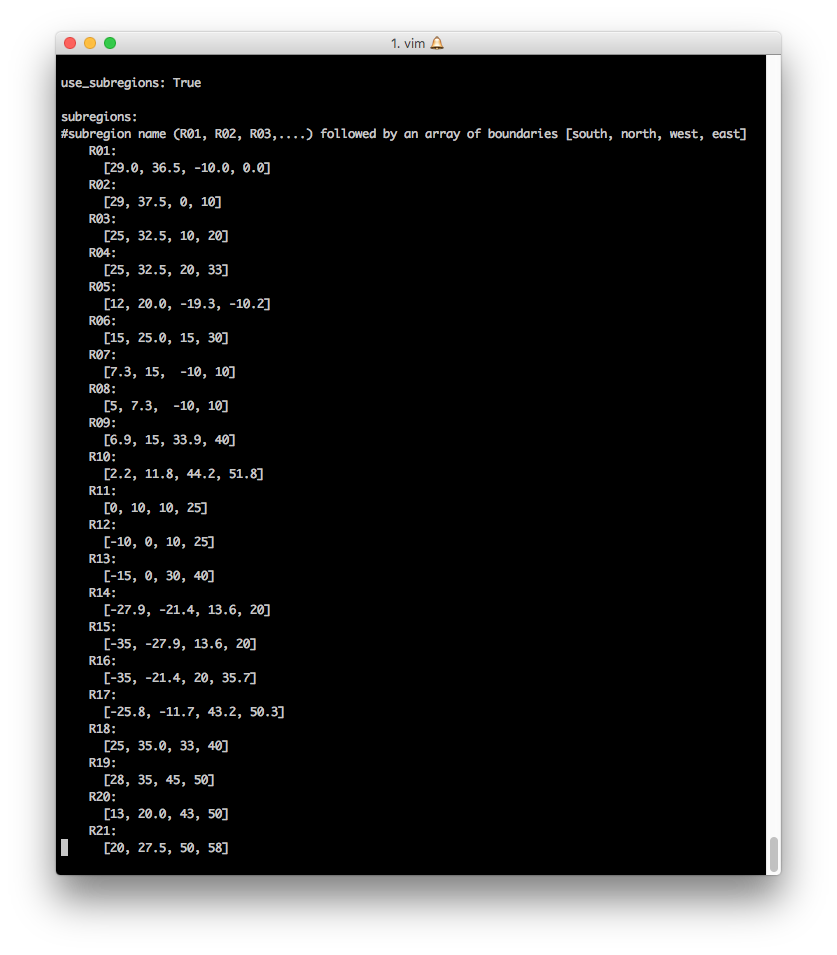
This section of the config file defines each of the subregions by indicating the boundaries in an array using latitude and longitude.
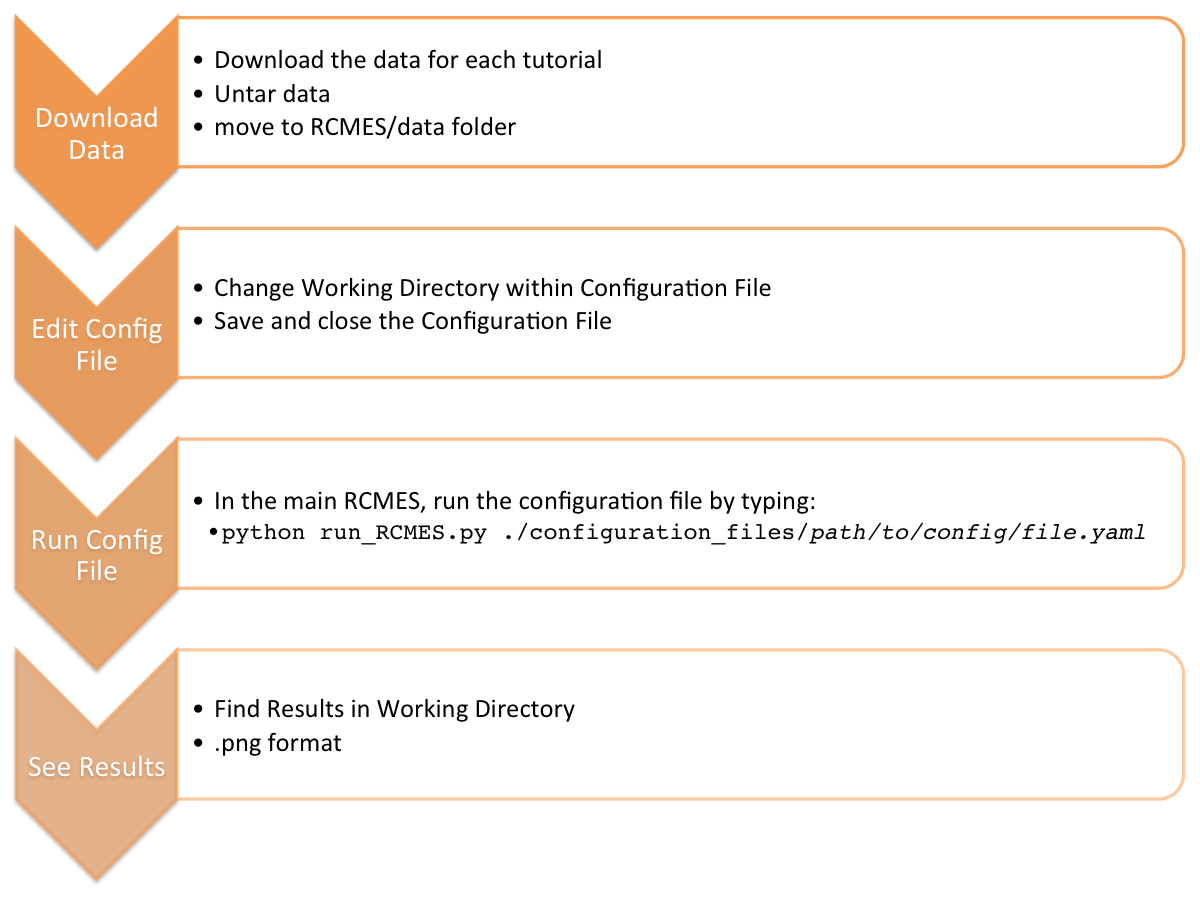
This training will provide a step-by-step guide for perfoming a simple model evaluation with RCMES using configuration files. We will reproduce some of the figures from Kim et al. (2013a) publication as an example. To replicate this paper in its entirety, please refer to the CF site for that paper.
If you have not already done so, please go to the RCMES Download Page and install RCMES using either VM or Easy OCW.
This tutorial uses model data that will need to be downloaded and saved to a specific directory within RCMES.
CLICK HERE to download the data for this tutorial.
If you are using VM for this tutorial, you will need to follow the instructions from Part VII. Using the VM for RCMES Tutorials found on the VM Install Page. These instructions will show you where to save the data and how to mount it within RCMES. Once you have your downloaded data mounted within RCMES in the VM, continue on to the Edit the Configuration File section of this tutorial.
If you are using Easy OCW for this tutorial, you will need to save the config_file_data folder to your data folder in RCMES. (~/climate/RCMES/data)
Note: You may need to create the data folder. To do so, using Terminal, move to the main RCMES folder, and type: "mkdir data".

Navigate to the folder containing the RCMES application. For example:
cd RCMES/configuration_files
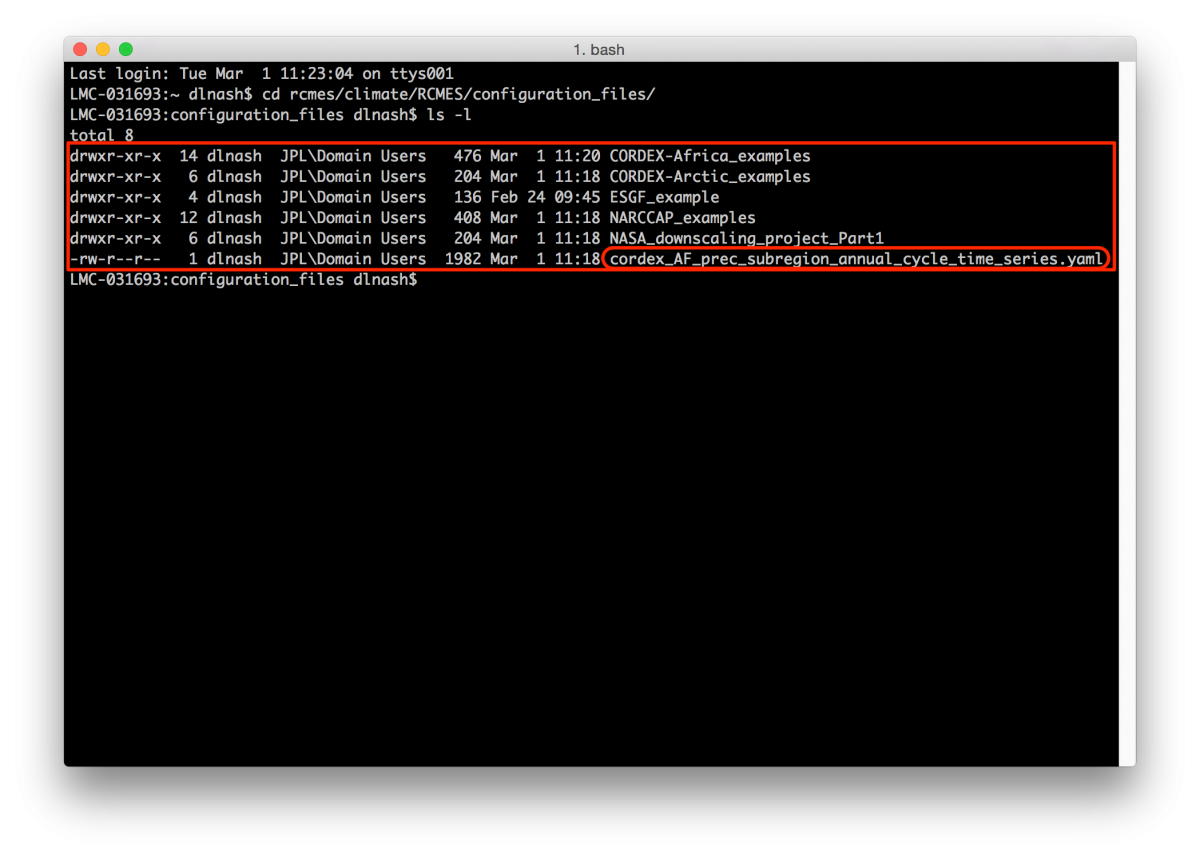
Type the following to see all of the example config files included in the folder
ls -l
All of the example config files are listed. This tutorial will use CORDEX-AFRICA precipitation config file.
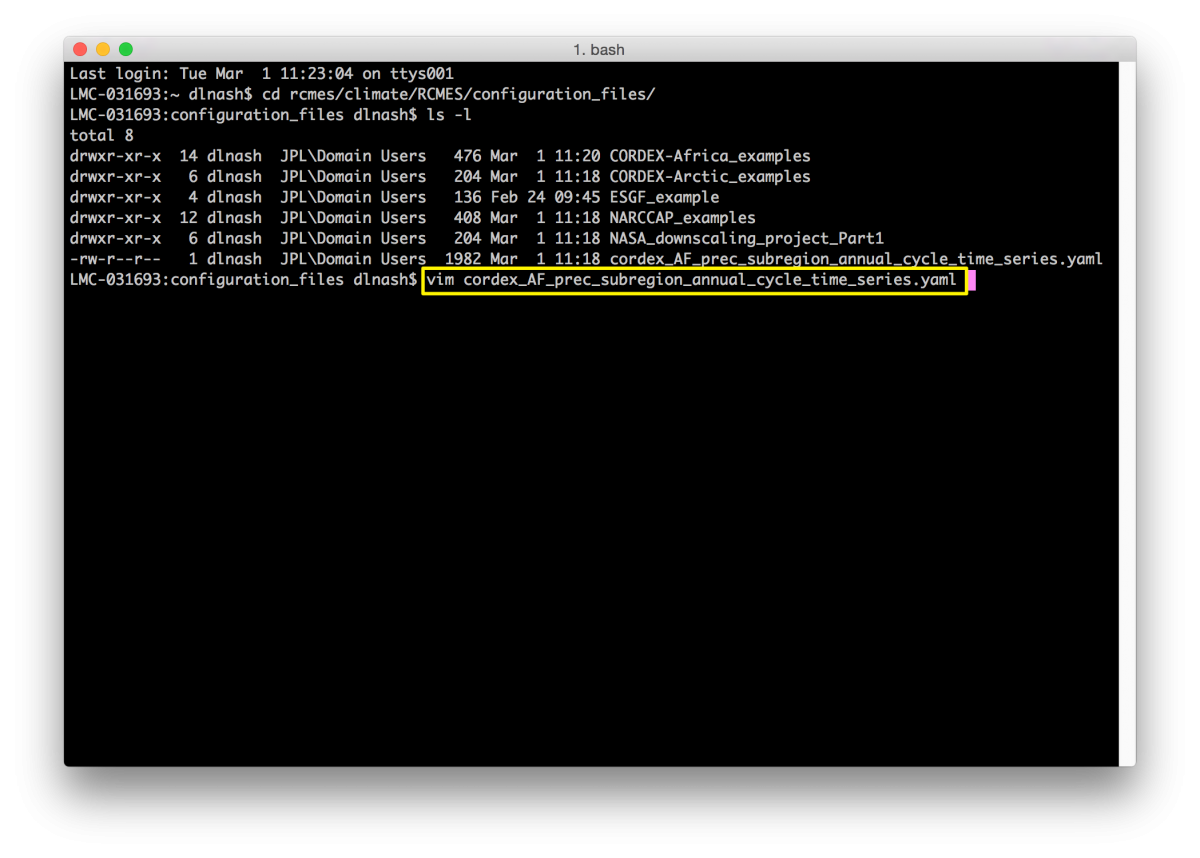
A text editor can be used to edit the config file before analysis. Here, we use vim for the text editor.
vim cordex_AF_prec_subregion_annual_cycle_time_series.yaml
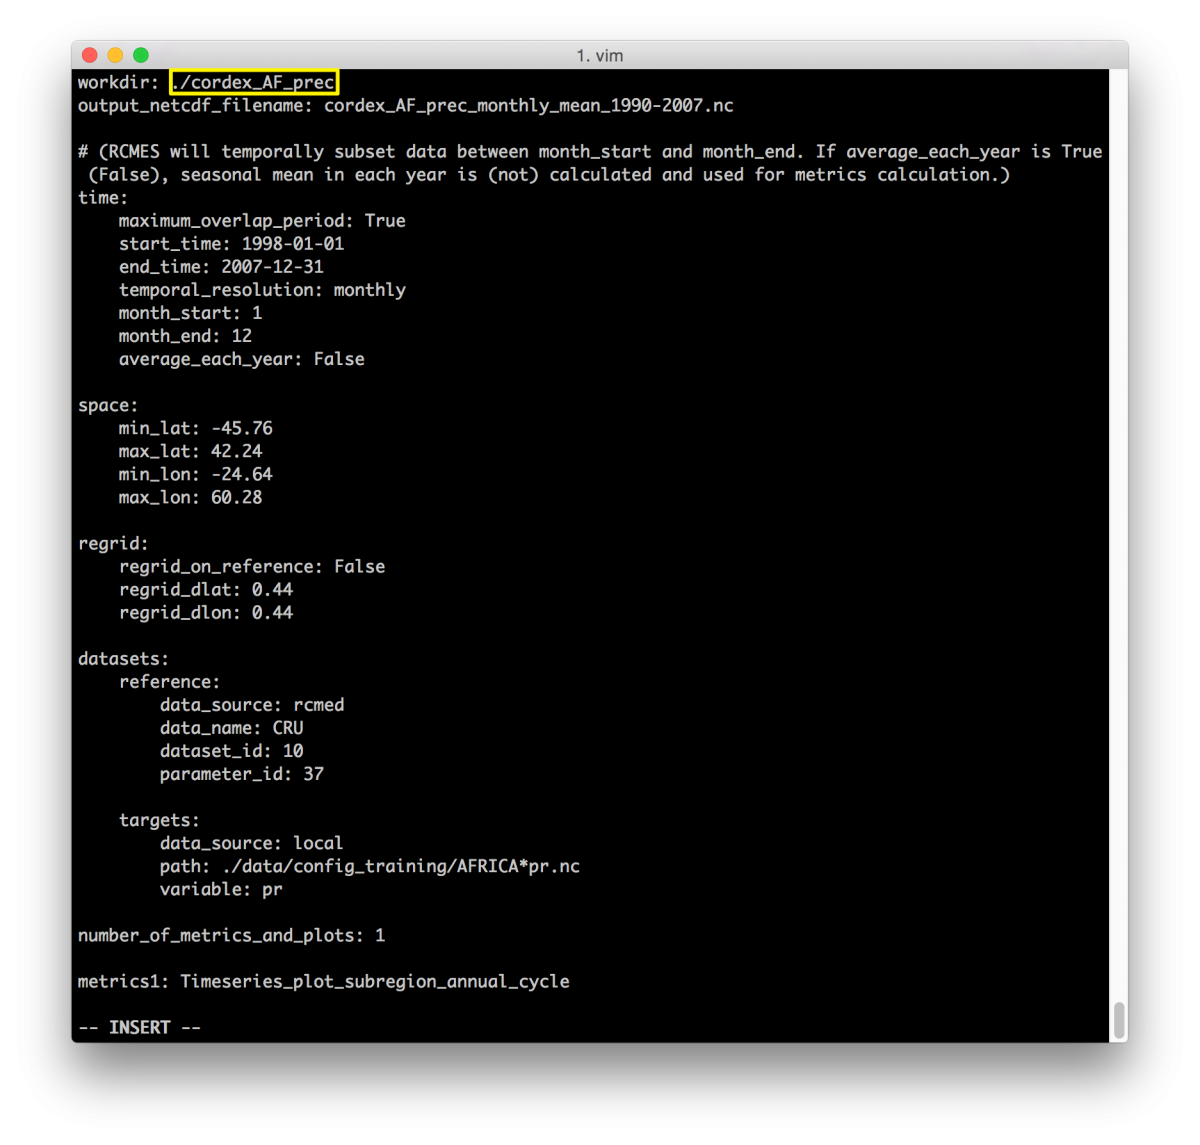
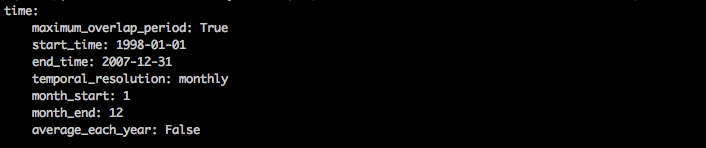
The sample model and observations are pre-loaded with this tutorial. You will only need to edit the working directory. Enter
i
to enter editing mode, then using the cursor arrows, navigate to the workdir to edit the path. A sample is shown below:
./cordex_AF_prec
Then press
esc
to exit insert mode, followed by
:wq
and press ENTER to save and exit vim editor.
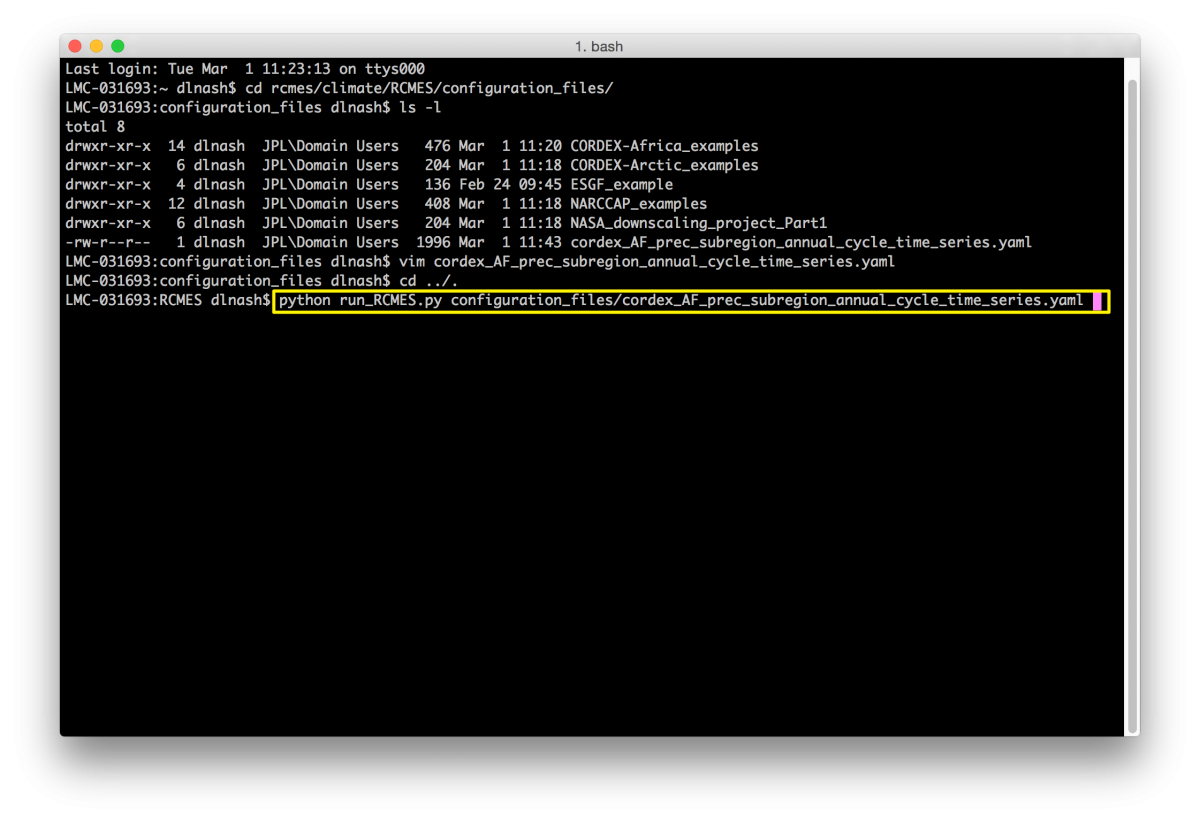
In the Terminal application, navigate to the folder containing the RCMES and execute the program by inputting
python run_RCMES.py ./configuration_files/cordex_AF_prec_subregion_annual_cycle_time_series.yaml
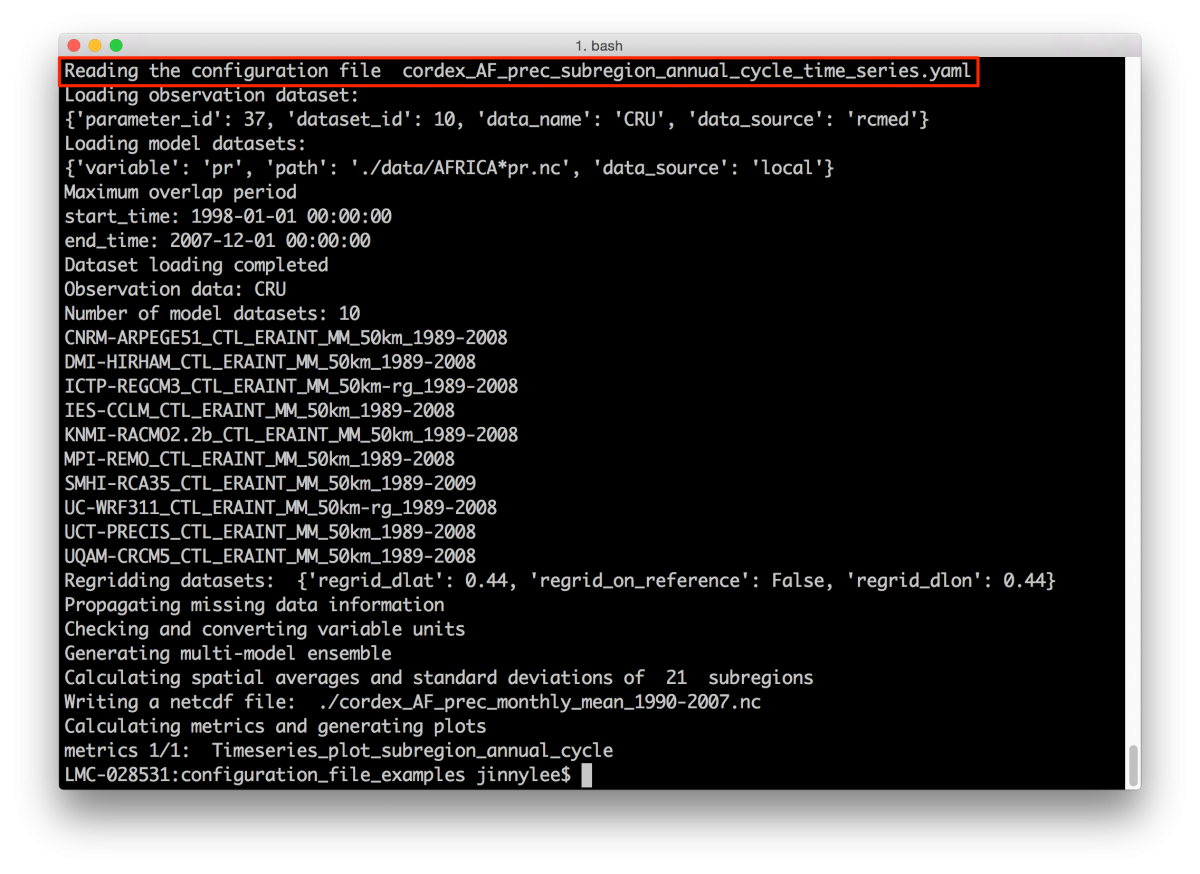
RCMES will output the progress of the analysis on the screen. It begins by reading the configuration file that was just edited.
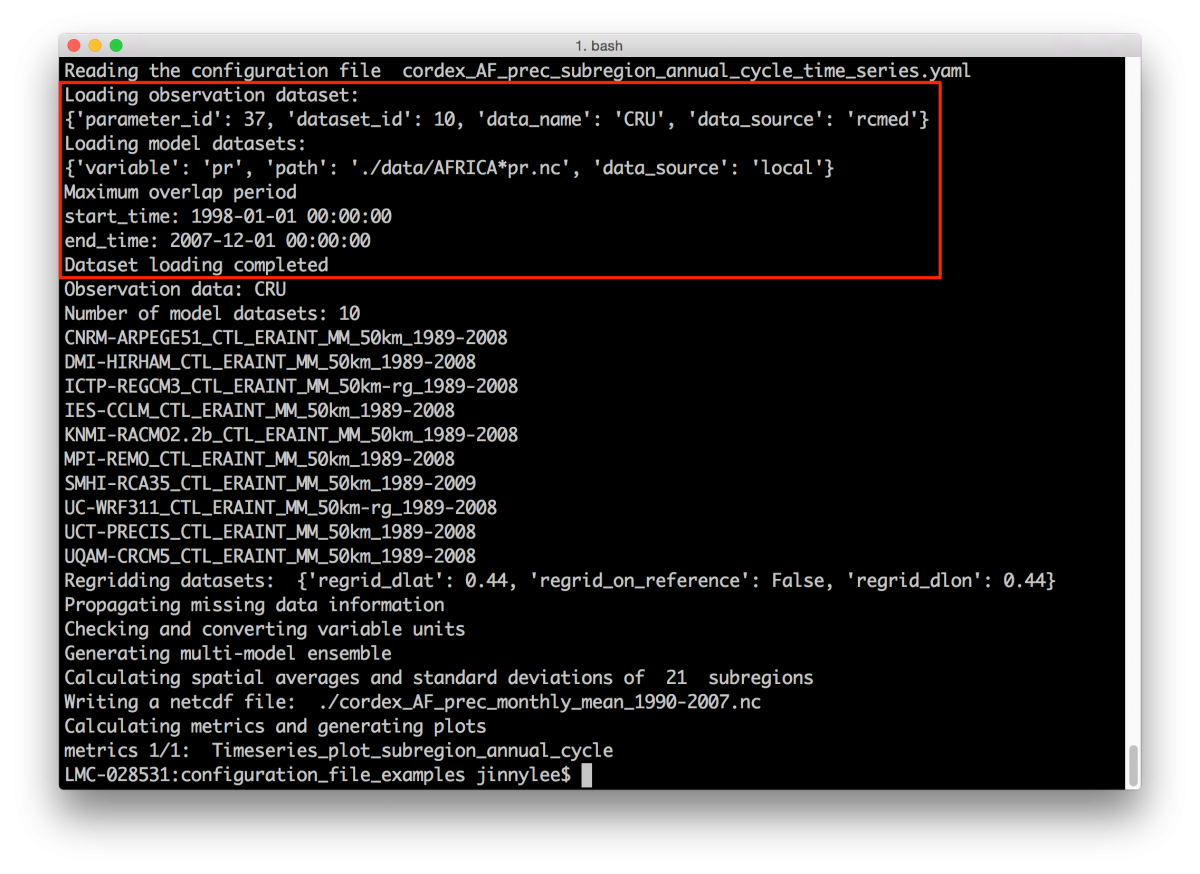
Then both observation and model datasets are loaded.
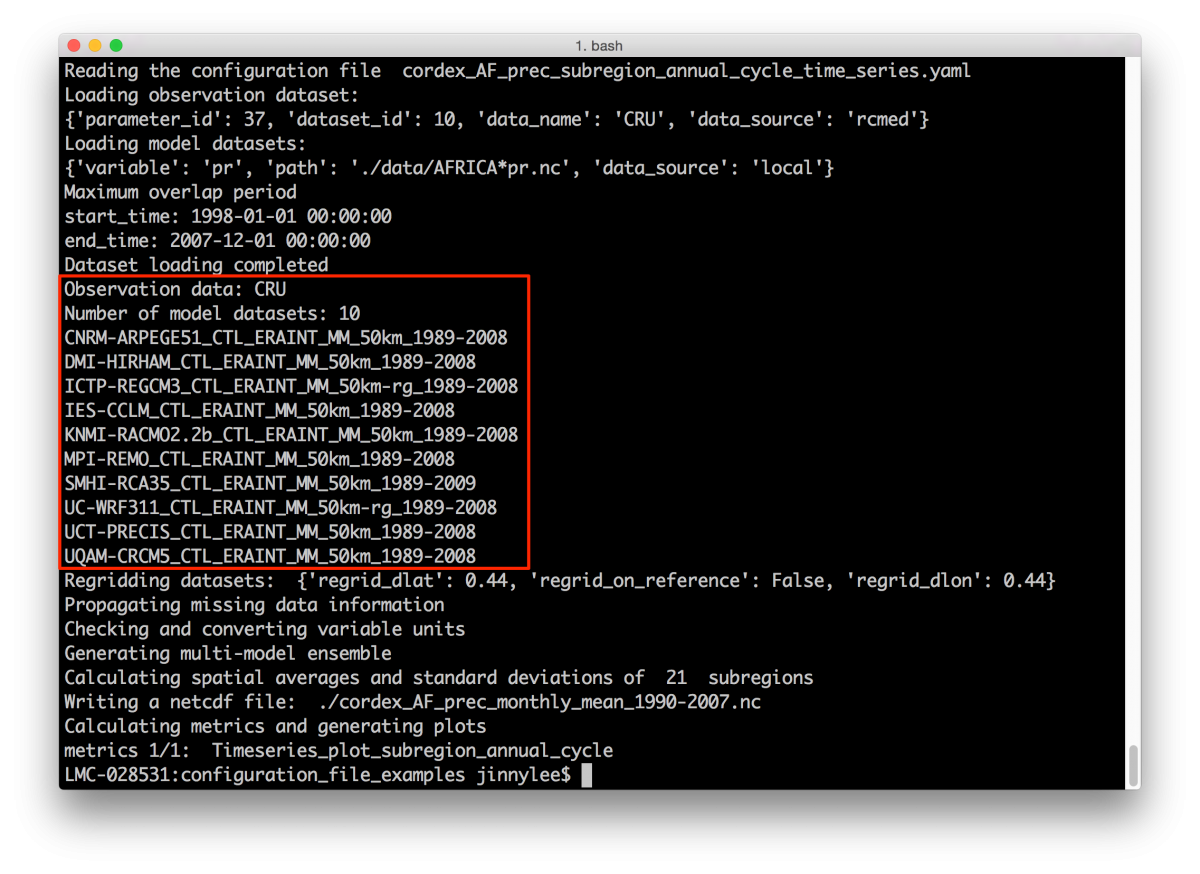
After the datasets are loaded, the screen outputs which observation, along with how many models and which models were loaded for analysis.
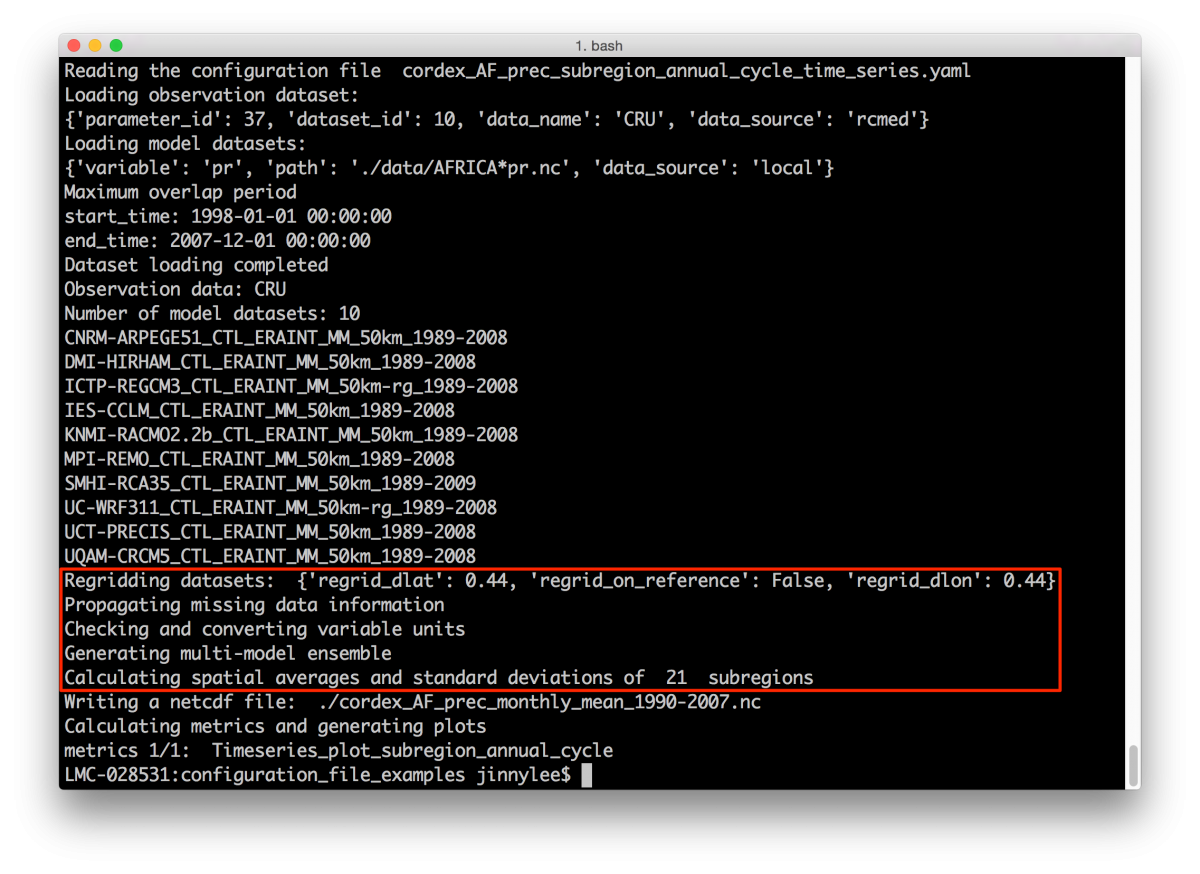
RCMES will then regrid the datasets to the resolution defined in the config file, propagate any missing data, confirm variable units, generate multi-model ensemble, and calculate spatial averages and standard deviation of the defined subregions.
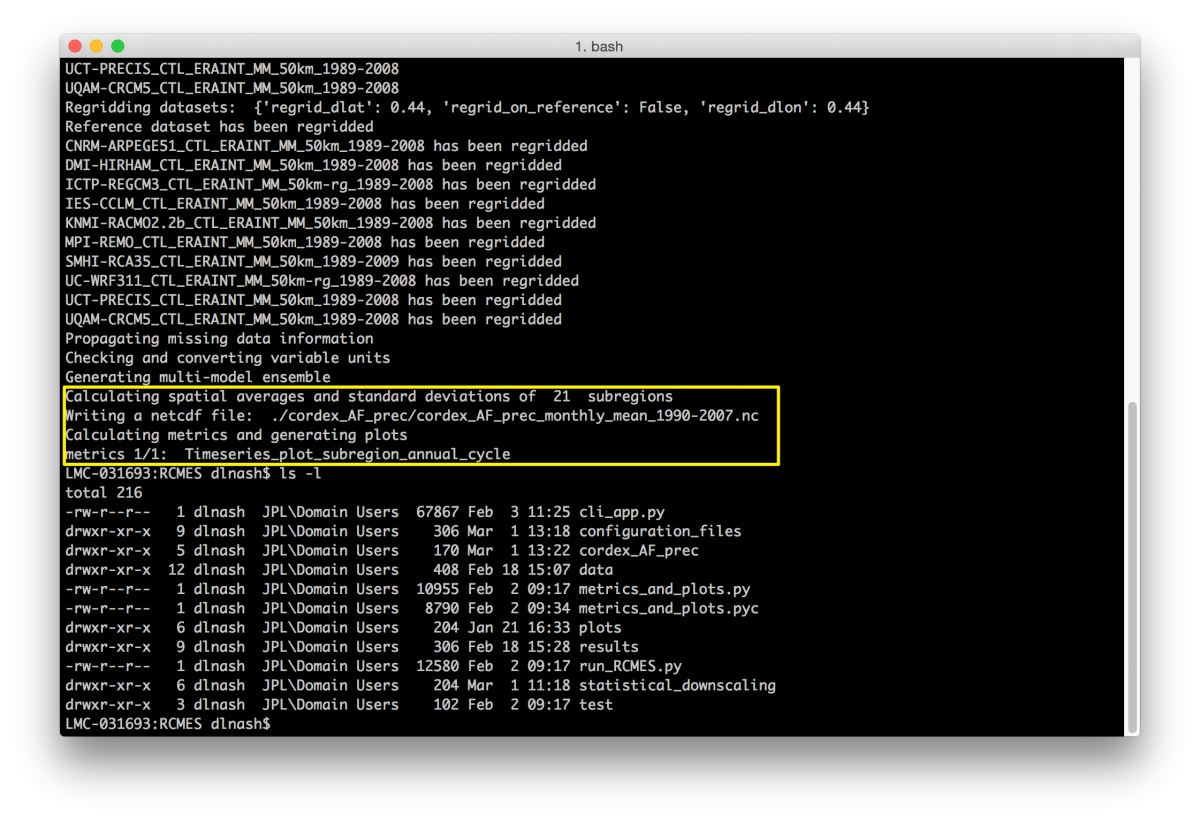
The results of the analysis is outputed as a netCDF file of the name that was specified in the config file and placed in the working directory.
Each of the metrics selected in the config file will be calculated and plots generated. All of the plots are saved in the working directory as a .png file. Once the analysis is complete, RCMES will exit back to the Terminal prompt.
In the Terminal prompt, enter
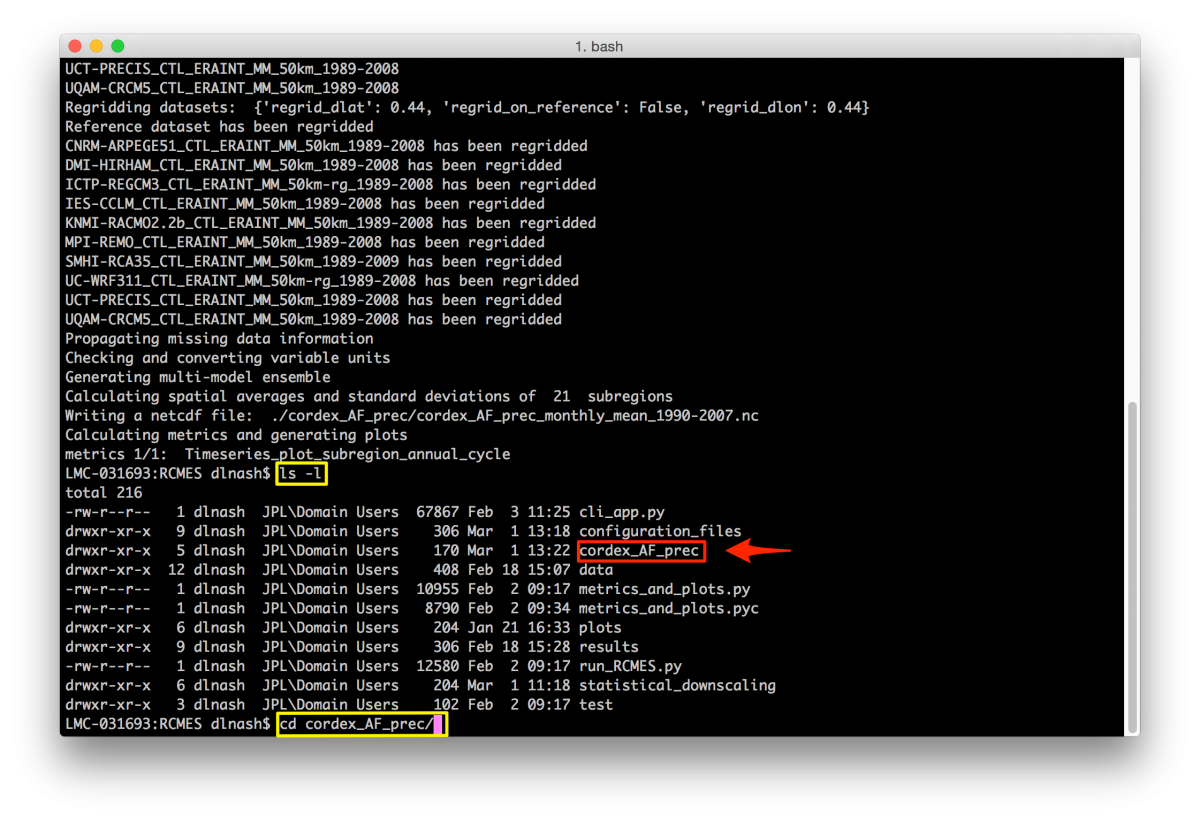
ls -l
to see a list of all the files in that directory.
To enter the working directory, input
cd cordex_AF_prec_annual
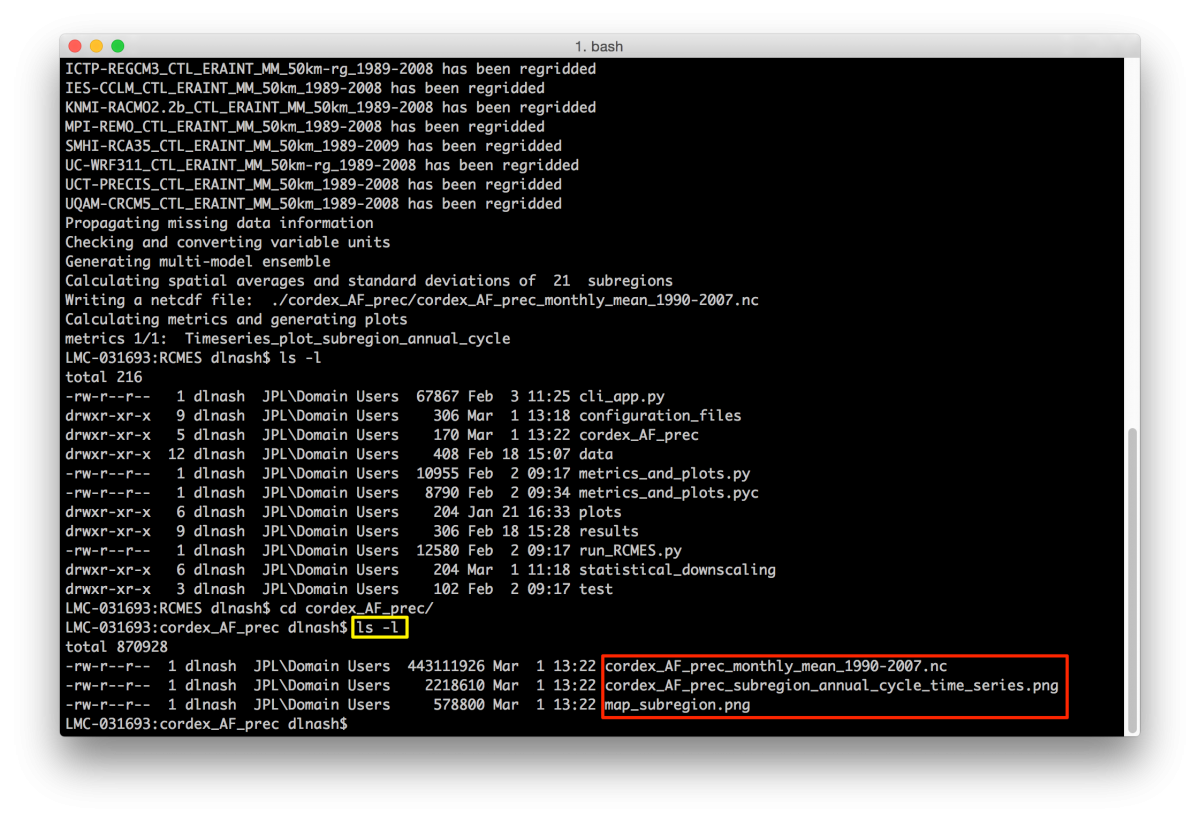
To take a look at the files inside the working directory, input
ls -l
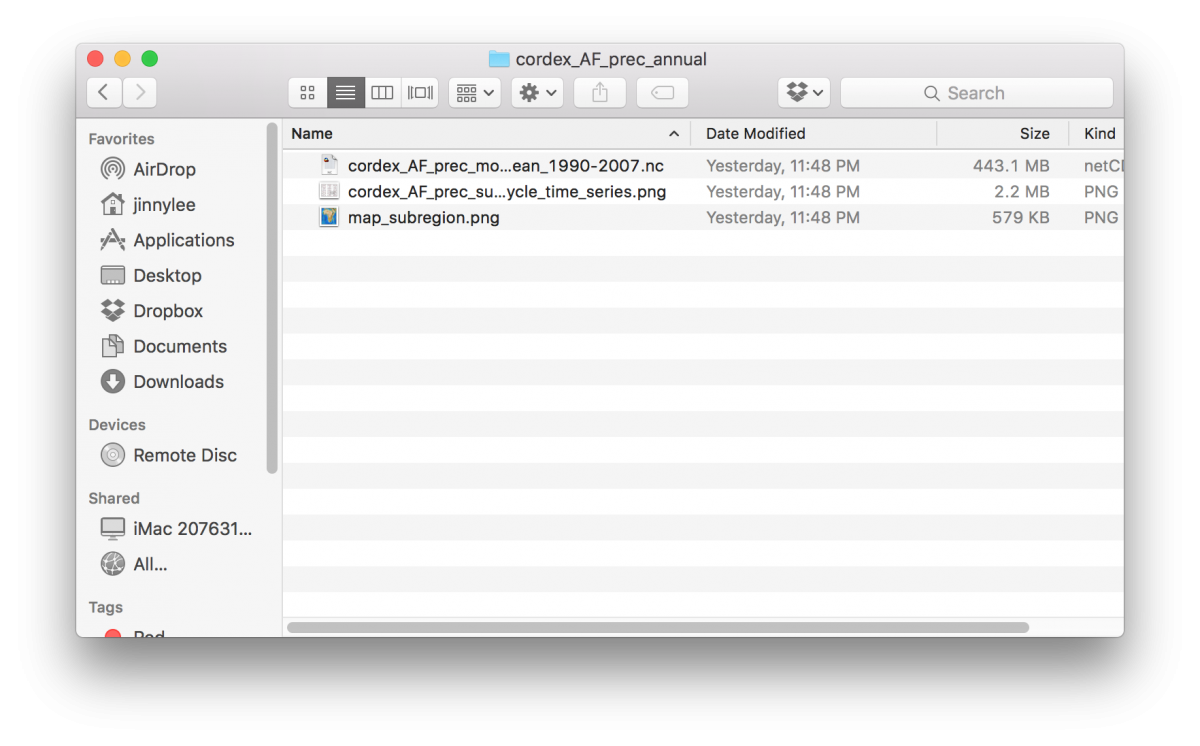
Here we can see the netCDF file that was created as well as the plots that were generated by RCMES.
Alternatively, you can navigate to the working directory inside your OS to see the created file and plots.
If you are working in a VM environment, and want to move your results to the folder shared with your host machine, follow the directions in Step 3 of Section VI of the Running the RCMES Virtual Machine Tutorial.
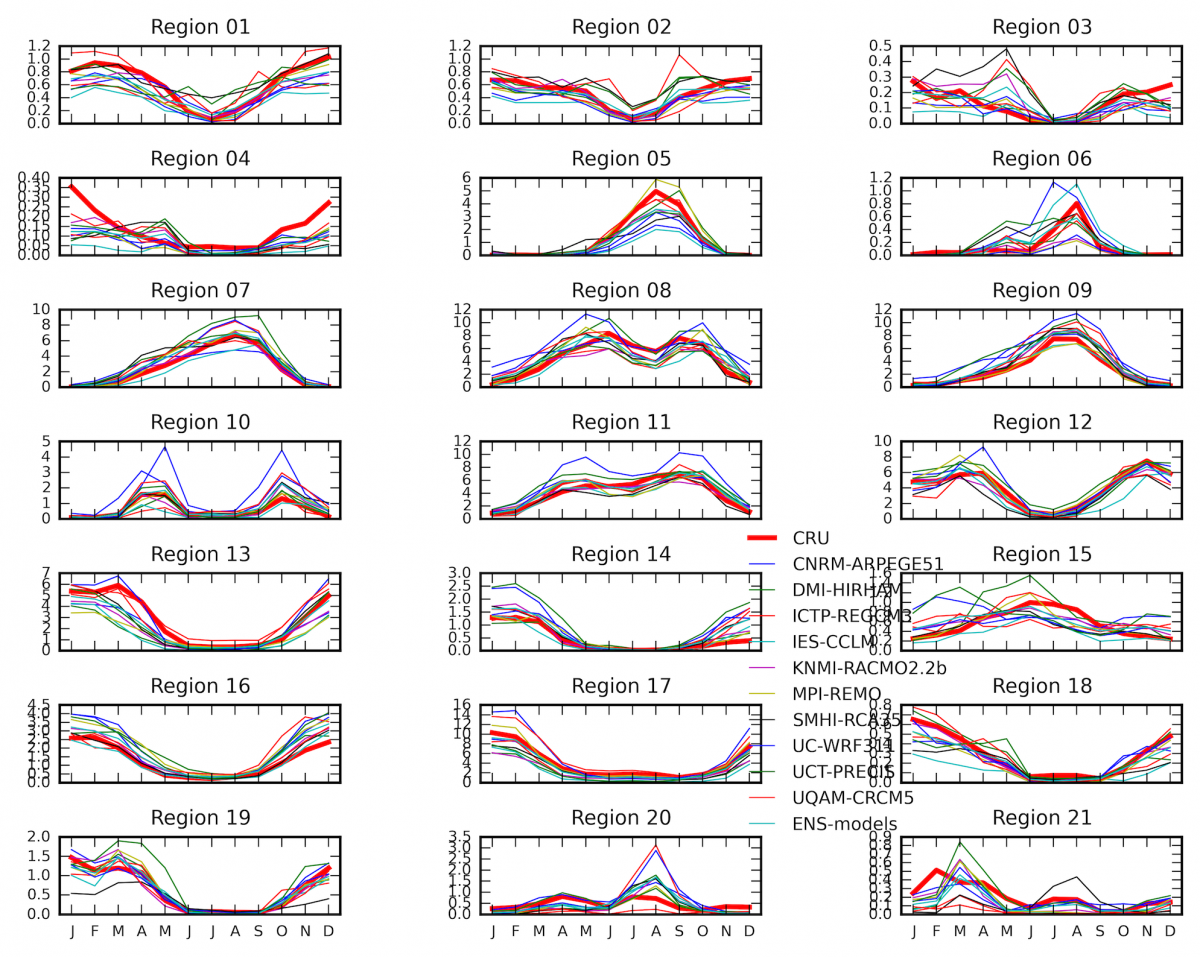
These following plots were produced by this tutorial and are found in your working directory.
(The figures from Kim et al. 2013a Cordex-Africa paper are referenced in bold with parentheses)
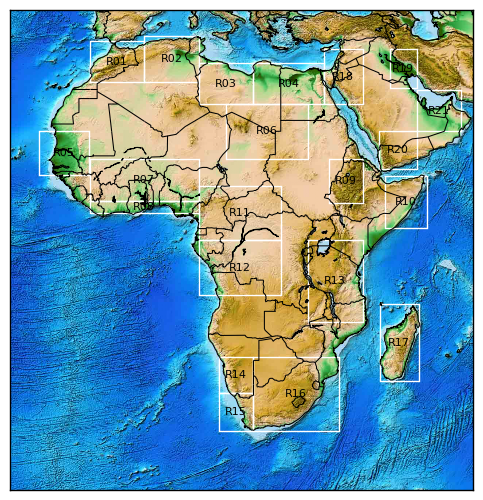
(Fig. 1a) The CORDEX-Africa domain and the terrain represented at a 0.44 degree resolution where the numbered boxes with white boundaries indicate the 21 sub-regions in which the area-mean time series are evaluated
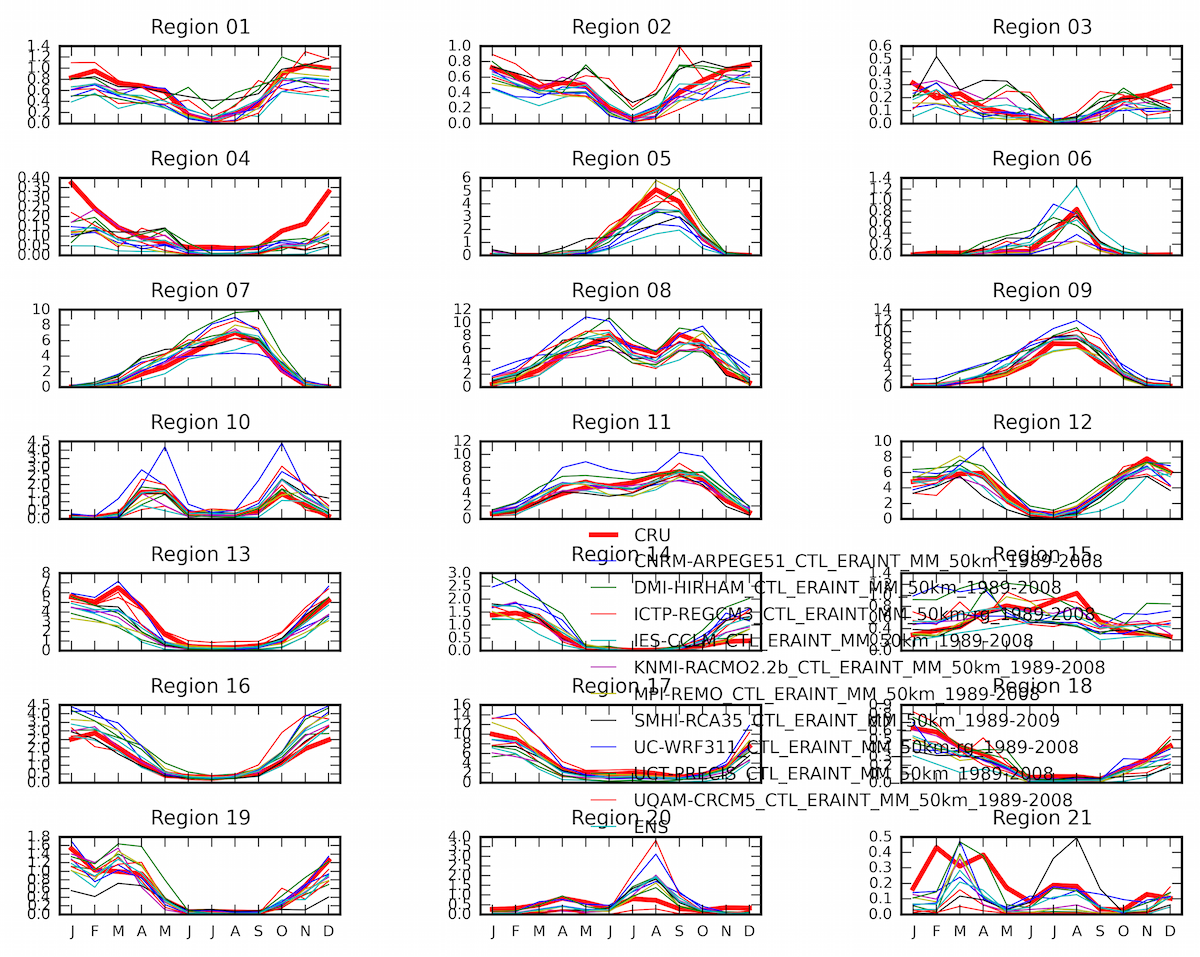
(Fig. 5) The simulated precipitation annual cycle (mm/day) in the 21 sub-regions